SheraEnergy SHERA_SM full analysis,charts,indicators,moving averages,SMA,DMA,EMA,ADX,MACD,RSIShera Energy SHERA_SM WideScreen charts, DMA,SMA,EMA technical analysis, forecast prediction, by indicators ADX,MACD,RSI,CCI NSE stock exchange
Daily price and charts and targets SheraEnergy Strong Daily Stock price targets for SheraEnergy SHERA_SM are 124.5 and 125.5 | Daily Target 1 | 124.33 | | Daily Target 2 | 124.67 | | Daily Target 3 | 125.33333333333 | | Daily Target 4 | 125.67 | | Daily Target 5 | 126.33 |
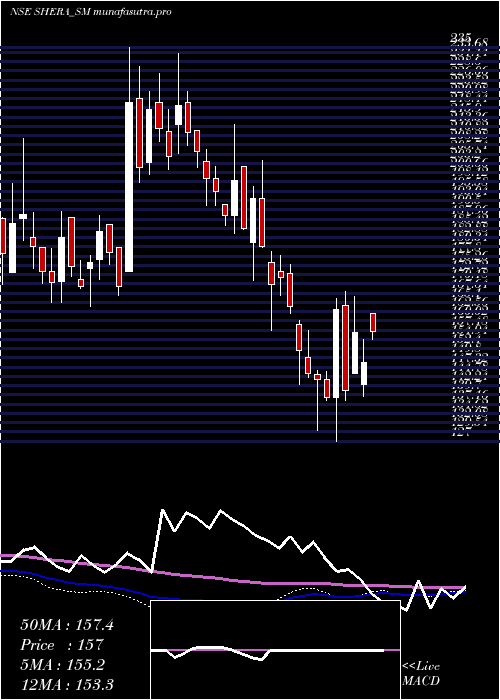
Daily price and volume Shera Energy
| Date |
Closing |
Open |
Range |
Volume |
Mon 27 October 2025 |
125.00 (-3.06%) |
126.00 |
125.00 - 126.00 |
0.198 times |
Fri 24 October 2025 |
128.95 (0.08%) |
128.95 |
128.95 - 128.95 |
0.099 times |
Thu 23 October 2025 |
128.85 (-0.12%) |
126.00 |
126.00 - 128.85 |
0.198 times |
Tue 21 October 2025 |
129.00 (0.39%) |
129.00 |
129.00 - 129.00 |
0.099 times |
Mon 20 October 2025 |
128.50 (1.98%) |
128.50 |
128.50 - 130.00 |
1.7822 times |
Fri 17 October 2025 |
126.00 (-3.3%) |
128.55 |
126.00 - 128.55 |
0.495 times |
Thu 16 October 2025 |
130.30 (4.24%) |
126.00 |
126.00 - 135.00 |
3.5644 times |
Wed 15 October 2025 |
125.00 (3.22%) |
124.00 |
123.35 - 125.40 |
1.3861 times |
Tue 14 October 2025 |
121.10 (-2.34%) |
124.50 |
121.05 - 125.00 |
1.0891 times |
Mon 13 October 2025 |
124.00 (-0.08%) |
121.05 |
121.05 - 124.50 |
1.0891 times |
Fri 10 October 2025 |
124.10 (0.49%) |
123.50 |
123.50 - 125.00 |
1.1881 times |

Weekly price and charts SheraEnergy Strong weekly Stock price targets for SheraEnergy SHERA_SM are 124.5 and 125.5 | Weekly Target 1 | 124.33 | | Weekly Target 2 | 124.67 | | Weekly Target 3 | 125.33333333333 | | Weekly Target 4 | 125.67 | | Weekly Target 5 | 126.33 |
Weekly price and volumes for Shera Energy
| Date |
Closing |
Open |
Range |
Volume |
Mon 27 October 2025 |
125.00 (-3.06%) |
126.00 |
125.00 - 126.00 |
0.0477 times |
Fri 24 October 2025 |
128.95 (2.34%) |
128.50 |
126.00 - 130.00 |
0.5251 times |
Fri 17 October 2025 |
126.00 (1.53%) |
121.05 |
121.05 - 135.00 |
1.8377 times |
Fri 10 October 2025 |
124.10 (-0.72%) |
125.00 |
122.05 - 125.75 |
0.9785 times |
Fri 03 October 2025 |
125.00 (-3.21%) |
128.00 |
122.25 - 128.00 |
0.6683 times |
Fri 26 September 2025 |
129.15 (-0.73%) |
132.00 |
128.00 - 134.00 |
0.9547 times |
Fri 19 September 2025 |
130.10 (-4.27%) |
136.30 |
130.00 - 136.30 |
1.0501 times |
Fri 12 September 2025 |
135.90 (-0.22%) |
134.05 |
132.00 - 136.30 |
1.1933 times |
Thu 04 September 2025 |
136.20 (-0.07%) |
138.00 |
132.80 - 139.00 |
1.0263 times |
Fri 29 August 2025 |
136.30 (-4.22%) |
142.00 |
135.00 - 142.00 |
1.7184 times |
Fri 22 August 2025 |
142.30 (0.81%) |
137.55 |
137.55 - 145.00 |
0.6683 times |
Monthly price and charts SheraEnergy Strong monthly Stock price targets for SheraEnergy SHERA_SM are 118.03 and 131.98 | Monthly Target 1 | 113.07 | | Monthly Target 2 | 119.03 | | Monthly Target 3 | 127.01666666667 | | Monthly Target 4 | 132.98 | | Monthly Target 5 | 140.97 |
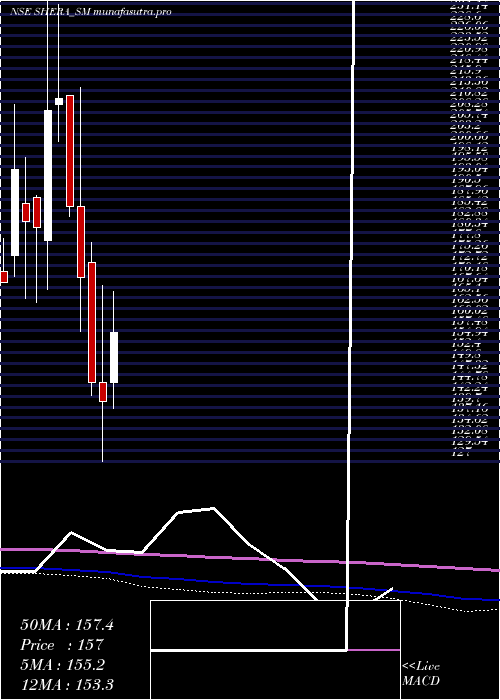
Monthly price and volumes Shera Energy
| Date |
Closing |
Open |
Range |
Volume |
Mon 27 October 2025 |
125.00 (-0.16%) |
125.00 |
121.05 - 135.00 |
0.3761 times |
Mon 29 September 2025 |
125.20 (-8.14%) |
138.00 |
125.20 - 139.00 |
0.4499 times |
Fri 29 August 2025 |
136.30 (-1.3%) |
140.00 |
134.00 - 154.00 |
1.1735 times |
Thu 31 July 2025 |
138.10 (-3.09%) |
142.50 |
134.00 - 145.00 |
0.6546 times |
Mon 30 June 2025 |
142.50 (-6.03%) |
151.00 |
141.10 - 165.00 |
0.8688 times |
Fri 30 May 2025 |
151.65 (2.22%) |
149.50 |
142.15 - 172.90 |
1.2069 times |
Wed 30 April 2025 |
148.35 (5.29%) |
145.45 |
139.25 - 166.70 |
0.6689 times |
Fri 28 March 2025 |
140.90 (-3.13%) |
145.40 |
127.00 - 168.00 |
1.5925 times |
Fri 28 February 2025 |
145.45 (-14.39%) |
173.45 |
142.50 - 178.00 |
0.8807 times |
Fri 31 January 2025 |
169.90 (-8.88%) |
186.45 |
157.25 - 214.00 |
2.1281 times |
Tue 31 December 2024 |
186.45 (-11.89%) |
212.20 |
184.00 - 212.30 |
1.7877 times |
DMA SMA EMA moving averages of Shera Energy SHERA_SM
DMA (daily moving average) of Shera Energy SHERA_SM
| DMA period | DMA value | | 5 day DMA | 128.06 | | 12 day DMA | 126.19 | | 20 day DMA | 126.07 | | 35 day DMA | 129.02 | | 50 day DMA | 132.32 | | 100 day DMA | 138.62 | | 150 day DMA | 142.72 | | 200 day DMA | 149.91 | EMA (exponential moving average) of Shera Energy SHERA_SM
| EMA period | EMA current | EMA prev | EMA prev2 | | 5 day EMA | 127.2 | 128.3 | 127.97 | | 12 day EMA | 126.96 | 127.32 | 127.02 | | 20 day EMA | 127.47 | 127.73 | 127.6 | | 35 day EMA | 129.73 | 130.01 | 130.07 | | 50 day EMA | 132.62 | 132.93 | 133.09 |
SMA (simple moving average) of Shera Energy SHERA_SM
| SMA period | SMA current | SMA prev | SMA prev2 | | 5 day SMA | 128.06 | 128.26 | 128.53 | | 12 day SMA | 126.19 | 126.07 | 125.57 | | 20 day SMA | 126.07 | 126.22 | 126.28 | | 35 day SMA | 129.02 | 129.38 | 129.61 | | 50 day SMA | 132.32 | 132.6 | 132.81 | | 100 day SMA | 138.62 | 138.91 | 139.21 | | 150 day SMA | 142.72 | 142.85 | 142.96 | | 200 day SMA | 149.91 | 150.22 | 150.51 |
|
|
