ShekhawatiIndustries SHEKHAWATI full analysis,charts,indicators,moving averages,SMA,DMA,EMA,ADX,MACD,RSIShekhawati Industries SHEKHAWATI WideScreen charts, DMA,SMA,EMA technical analysis, forecast prediction, by indicators ADX,MACD,RSI,CCI NSE stock exchange
Daily price and charts and targets ShekhawatiIndustries Strong Daily Stock price targets for ShekhawatiIndustries SHEKHAWATI are 20.5 and 21.41 | Daily Target 1 | 19.79 | | Daily Target 2 | 20.3 | | Daily Target 3 | 20.7 | | Daily Target 4 | 21.21 | | Daily Target 5 | 21.61 |
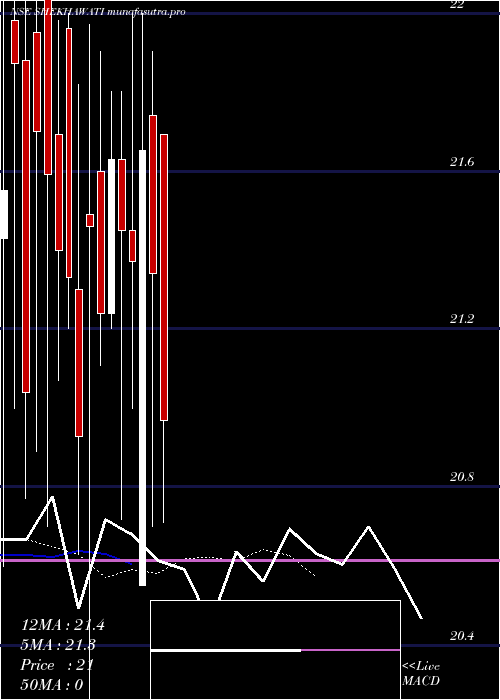
Daily price and volume Shekhawati Industries
| Date |
Closing |
Open |
Range |
Volume |
Wed 29 October 2025 |
20.81 (1.02%) |
20.65 |
20.19 - 21.10 |
1.057 times |
Tue 28 October 2025 |
20.60 (-2.18%) |
21.10 |
20.47 - 21.18 |
0.3811 times |
Mon 27 October 2025 |
21.06 (0.14%) |
20.35 |
20.35 - 21.49 |
0.6239 times |
Fri 24 October 2025 |
21.03 (-0.71%) |
21.20 |
20.83 - 21.49 |
0.187 times |
Thu 23 October 2025 |
21.18 (0.14%) |
20.85 |
20.81 - 21.61 |
0.9416 times |
Tue 21 October 2025 |
21.15 (2.37%) |
21.07 |
20.67 - 21.85 |
1.4306 times |
Mon 20 October 2025 |
20.66 (-3.55%) |
21.42 |
20.12 - 22.00 |
1.8641 times |
Fri 17 October 2025 |
21.42 (1.32%) |
20.17 |
20.17 - 21.90 |
1.3484 times |
Thu 16 October 2025 |
21.14 (3.27%) |
20.60 |
20.60 - 21.29 |
0.8541 times |
Wed 15 October 2025 |
20.47 (-1.44%) |
20.80 |
20.20 - 21.00 |
1.3121 times |
Tue 14 October 2025 |
20.77 (-1.38%) |
20.79 |
20.52 - 21.05 |
0.7806 times |
Weekly price and charts ShekhawatiIndustries Strong weekly Stock price targets for ShekhawatiIndustries SHEKHAWATI are 20.5 and 21.8 | Weekly Target 1 | 19.53 | | Weekly Target 2 | 20.17 | | Weekly Target 3 | 20.83 | | Weekly Target 4 | 21.47 | | Weekly Target 5 | 22.13 |
Weekly price and volumes for Shekhawati Industries
| Date |
Closing |
Open |
Range |
Volume |
Wed 29 October 2025 |
20.81 (-1.05%) |
20.35 |
20.19 - 21.49 |
0.304 times |
Fri 24 October 2025 |
21.03 (-1.82%) |
21.42 |
20.12 - 22.00 |
0.652 times |
Fri 17 October 2025 |
21.42 (6.57%) |
20.43 |
20.00 - 21.90 |
1.1387 times |
Fri 10 October 2025 |
20.10 (-4.29%) |
21.11 |
19.90 - 24.01 |
2.6668 times |
Fri 03 October 2025 |
21.00 (-3.71%) |
21.98 |
20.10 - 22.60 |
0.8183 times |
Fri 26 September 2025 |
21.81 (-11.23%) |
24.60 |
21.21 - 24.80 |
1.5277 times |
Fri 19 September 2025 |
24.57 (0.7%) |
24.40 |
23.26 - 25.38 |
0.8049 times |
Fri 12 September 2025 |
24.40 (12.34%) |
22.75 |
22.74 - 25.75 |
1.2749 times |
Fri 05 September 2025 |
21.72 (1.64%) |
20.55 |
20.55 - 22.00 |
0.5986 times |
Fri 29 August 2025 |
21.37 (-0.42%) |
21.60 |
20.72 - 22.00 |
0.2141 times |
Fri 22 August 2025 |
21.46 (-1.11%) |
22.49 |
20.00 - 22.78 |
0.7139 times |

Monthly price and charts ShekhawatiIndustries Strong monthly Stock price targets for ShekhawatiIndustries SHEKHAWATI are 18.3 and 22.41 | Monthly Target 1 | 17.46 | | Monthly Target 2 | 19.14 | | Monthly Target 3 | 21.573333333333 | | Monthly Target 4 | 23.25 | | Monthly Target 5 | 25.68 |
Monthly price and volumes Shekhawati Industries
| Date |
Closing |
Open |
Range |
Volume |
Wed 29 October 2025 |
20.81 (-0.57%) |
20.94 |
19.90 - 24.01 |
1.3876 times |
Tue 30 September 2025 |
20.93 (-2.06%) |
20.55 |
20.51 - 25.75 |
1.2172 times |
Fri 29 August 2025 |
21.37 (0%) |
21.43 |
20.00 - 22.78 |
0.3953 times |
Wed 29 October 2025 |
(0%) |
|
- |
0 times |

DMA SMA EMA moving averages of Shekhawati Industries SHEKHAWATI
DMA (daily moving average) of Shekhawati Industries SHEKHAWATI
| DMA period | DMA value | | 5 day DMA | 20.94 | | 12 day DMA | 20.95 | | 20 day DMA | 21.07 | | 35 day DMA | 22.09 | | 50 day DMA | 21.89 | | 100 day DMA | | | 150 day DMA | | | 200 day DMA | | EMA (exponential moving average) of Shekhawati Industries SHEKHAWATI
| EMA period | EMA current | EMA prev | EMA prev2 | | 5 day EMA | 20.88 | 20.91 | 21.06 | | 12 day EMA | 21.02 | 21.06 | 21.14 | | 20 day EMA | 21.22 | 21.26 | 21.33 | | 35 day EMA | 21.45 | 21.49 | 21.54 | | 50 day EMA | 21.78 | 21.82 | 21.87 |
SMA (simple moving average) of Shekhawati Industries SHEKHAWATI
| SMA period | SMA current | SMA prev | SMA prev2 | | 5 day SMA | 20.94 | 21 | 21.02 | | 12 day SMA | 20.95 | 20.89 | 20.94 | | 20 day SMA | 21.07 | 21.1 | 21.16 | | 35 day SMA | 22.09 | 22.14 | 22.17 | | 50 day SMA | 21.89 | 21.91 | 21.92 | | 100 day SMA | | 150 day SMA | | 200 day SMA |
|
|
