GoldmanSach SHARIABEES full analysis,charts,indicators,moving averages,SMA,DMA,EMA,ADX,MACD,RSIGoldman Sach SHARIABEES WideScreen charts, DMA,SMA,EMA technical analysis, forecast prediction, by indicators ADX,MACD,RSI,CCI NSE stock exchange
Daily price and charts and targets GoldmanSach Strong Daily Stock price targets for GoldmanSach SHARIABEES are 505.02 and 509.45 | Daily Target 1 | 501.58 | | Daily Target 2 | 504.03 | | Daily Target 3 | 506.01333333333 | | Daily Target 4 | 508.46 | | Daily Target 5 | 510.44 |
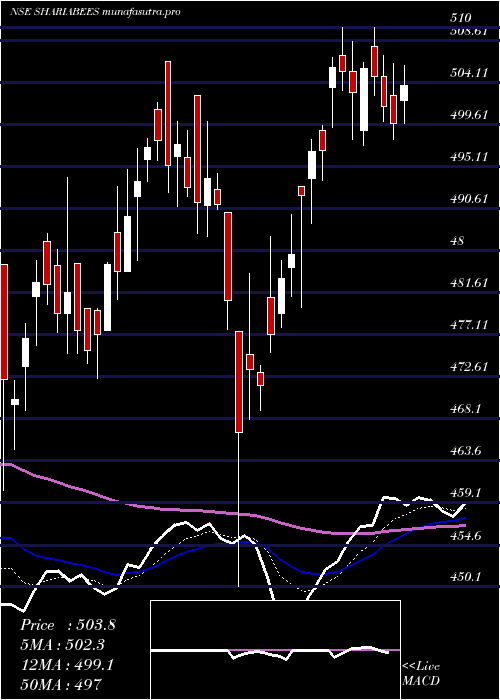
Daily price and volume Goldman Sach
| Date |
Closing |
Open |
Range |
Volume |
Wed 29 October 2025 |
506.47 (0.55%) |
504.56 |
503.57 - 508.00 |
0.8978 times |
Tue 28 October 2025 |
503.69 (-0.56%) |
506.54 |
501.75 - 508.23 |
0.6487 times |
Mon 27 October 2025 |
506.54 (0.43%) |
506.91 |
501.99 - 507.00 |
0.6841 times |
Fri 24 October 2025 |
504.39 (-0.25%) |
508.15 |
501.01 - 508.15 |
0.8462 times |
Thu 23 October 2025 |
505.63 (1.13%) |
503.33 |
490.66 - 510.48 |
3.2902 times |
Tue 21 October 2025 |
499.98 (-0.17%) |
506.10 |
495.81 - 506.10 |
0.5696 times |
Mon 20 October 2025 |
500.82 (0.83%) |
496.75 |
496.70 - 502.16 |
1.1321 times |
Fri 17 October 2025 |
496.71 (0.34%) |
495.01 |
489.79 - 498.89 |
0.7473 times |
Thu 16 October 2025 |
495.01 (0.67%) |
491.71 |
485.45 - 496.22 |
0.6358 times |
Wed 15 October 2025 |
491.71 (0.19%) |
492.46 |
485.16 - 493.14 |
0.5483 times |
Tue 14 October 2025 |
490.76 (-0.26%) |
494.50 |
485.91 - 496.97 |
0.7276 times |
Weekly price and charts GoldmanSach Strong weekly Stock price targets for GoldmanSach SHARIABEES are 500.87 and 507.35 | Weekly Target 1 | 499 | | Weekly Target 2 | 502.74 | | Weekly Target 3 | 505.48333333333 | | Weekly Target 4 | 509.22 | | Weekly Target 5 | 511.96 |
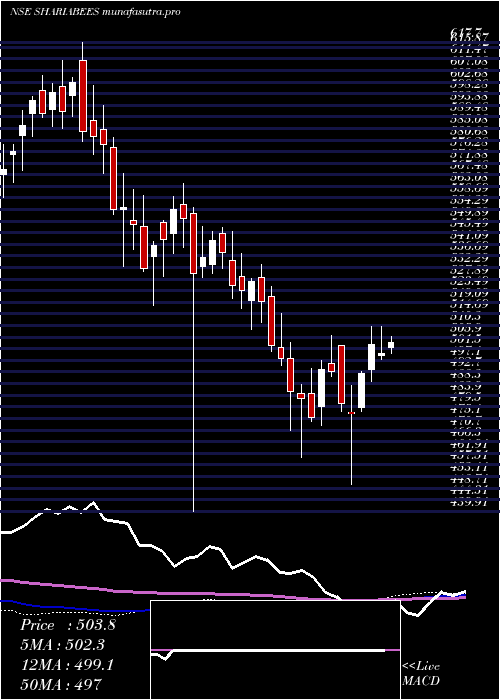
Weekly price and volumes for Goldman Sach
| Date |
Closing |
Open |
Range |
Volume |
Wed 29 October 2025 |
506.47 (0.41%) |
506.91 |
501.75 - 508.23 |
0.658 times |
Fri 24 October 2025 |
504.39 (1.55%) |
496.75 |
490.66 - 510.48 |
1.7222 times |
Fri 17 October 2025 |
496.71 (0.09%) |
496.27 |
485.16 - 498.89 |
1.1145 times |
Fri 10 October 2025 |
496.27 (1.98%) |
488.22 |
484.50 - 498.25 |
0.9545 times |
Fri 03 October 2025 |
486.65 (0.65%) |
486.78 |
479.06 - 492.00 |
0.821 times |
Fri 26 September 2025 |
483.51 (-4.72%) |
507.50 |
481.60 - 509.74 |
1.3693 times |
Fri 19 September 2025 |
507.44 (0.52%) |
519.96 |
491.58 - 519.96 |
0.862 times |
Fri 12 September 2025 |
504.82 (1.2%) |
511.29 |
494.05 - 511.29 |
0.7277 times |
Fri 05 September 2025 |
498.82 (0.3%) |
512.26 |
493.05 - 512.26 |
0.878 times |
Fri 29 August 2025 |
497.34 (-0.63%) |
503.00 |
495.13 - 506.55 |
0.8929 times |
Fri 22 August 2025 |
500.50 (1.87%) |
493.50 |
490.47 - 513.00 |
1.2528 times |
Monthly price and charts GoldmanSach Strong monthly Stock price targets for GoldmanSach SHARIABEES are 493.75 and 523.2 | Monthly Target 1 | 469.88 | | Monthly Target 2 | 488.17 | | Monthly Target 3 | 499.32666666667 | | Monthly Target 4 | 517.62 | | Monthly Target 5 | 528.78 |
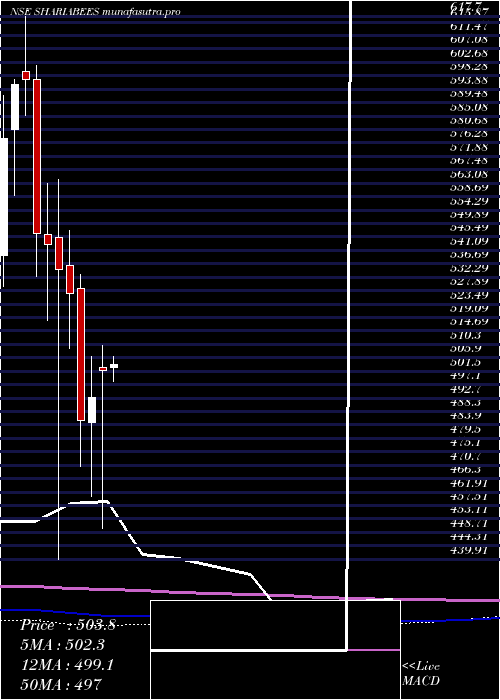
Monthly price and volumes Goldman Sach
| Date |
Closing |
Open |
Range |
Volume |
Wed 29 October 2025 |
506.47 (4.88%) |
484.54 |
481.03 - 510.48 |
1.3495 times |
Tue 30 September 2025 |
482.89 (-2.91%) |
512.26 |
479.06 - 519.96 |
1.2016 times |
Fri 29 August 2025 |
497.34 (0.79%) |
492.19 |
474.96 - 513.00 |
1.5114 times |
Thu 31 July 2025 |
493.42 (-4.35%) |
518.06 |
487.06 - 537.63 |
1.3158 times |
Mon 30 June 2025 |
515.88 (2.36%) |
504.00 |
497.43 - 525.31 |
0.9454 times |
Fri 30 May 2025 |
504.00 (0.49%) |
502.76 |
487.43 - 525.00 |
1.0691 times |
Wed 30 April 2025 |
501.56 (1.77%) |
502.72 |
450.10 - 510.00 |
0.849 times |
Fri 28 March 2025 |
492.86 (1.54%) |
484.61 |
460.41 - 506.40 |
0.6997 times |
Fri 28 February 2025 |
485.37 (-7.87%) |
528.41 |
470.36 - 533.30 |
0.5116 times |
Fri 31 January 2025 |
526.82 (-1.47%) |
536.25 |
509.02 - 547.54 |
0.547 times |
Tue 31 December 2024 |
534.70 (-1.53%) |
545.39 |
439.91 - 564.22 |
0.5218 times |
DMA SMA EMA moving averages of Goldman Sach SHARIABEES
DMA (daily moving average) of Goldman Sach SHARIABEES
| DMA period | DMA value | | 5 day DMA | 505.34 | | 12 day DMA | 499.48 | | 20 day DMA | 495.68 | | 35 day DMA | 497.35 | | 50 day DMA | 498.31 | | 100 day DMA | 500.92 | | 150 day DMA | 500.08 | | 200 day DMA | 501.47 | EMA (exponential moving average) of Goldman Sach SHARIABEES
| EMA period | EMA current | EMA prev | EMA prev2 | | 5 day EMA | 504.44 | 503.42 | 503.28 | | 12 day EMA | 500.95 | 499.95 | 499.27 | | 20 day EMA | 498.94 | 498.15 | 497.57 | | 35 day EMA | 497.97 | 497.47 | 497.1 | | 50 day EMA | 498.16 | 497.82 | 497.58 |
SMA (simple moving average) of Goldman Sach SHARIABEES
| SMA period | SMA current | SMA prev | SMA prev2 | | 5 day SMA | 505.34 | 504.05 | 503.47 | | 12 day SMA | 499.48 | 498.63 | 497.86 | | 20 day SMA | 495.68 | 494.44 | 493.44 | | 35 day SMA | 497.35 | 497.02 | 496.88 | | 50 day SMA | 498.31 | 498.01 | 497.75 | | 100 day SMA | 500.92 | 500.88 | 500.83 | | 150 day SMA | 500.08 | 499.97 | 499.83 | | 200 day SMA | 501.47 | 501.61 | 501.78 |
|
|
