ShantiGold SHANTIGOLD full analysis,charts,indicators,moving averages,SMA,DMA,EMA,ADX,MACD,RSIShanti Gold SHANTIGOLD WideScreen charts, DMA,SMA,EMA technical analysis, forecast prediction, by indicators ADX,MACD,RSI,CCI NSE stock exchange
Daily price and charts and targets ShantiGold Strong Daily Stock price targets for ShantiGold SHANTIGOLD are 210.89 and 220.23 | Daily Target 1 | 203.74 | | Daily Target 2 | 208.7 | | Daily Target 3 | 213.07666666667 | | Daily Target 4 | 218.04 | | Daily Target 5 | 222.42 |
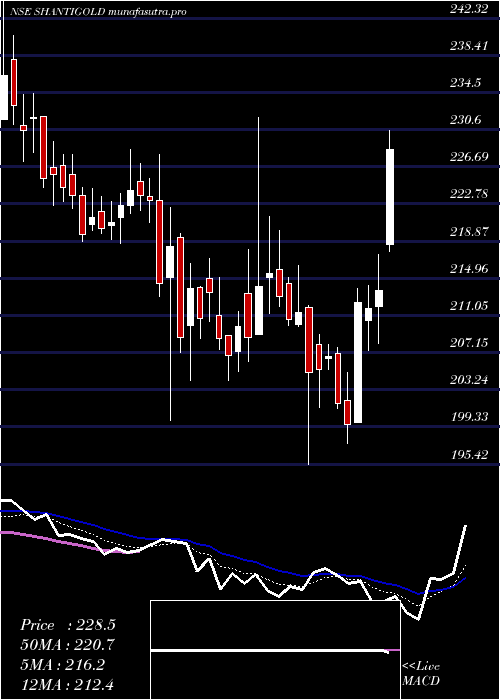
Daily price and volume Shanti Gold
| Date |
Closing |
Open |
Range |
Volume |
Wed 29 October 2025 |
213.67 (0.9%) |
212.00 |
208.11 - 217.45 |
1.418 times |
Tue 28 October 2025 |
211.77 (-0.29%) |
210.50 |
207.31 - 214.20 |
1.1935 times |
Mon 27 October 2025 |
212.39 (6.4%) |
199.80 |
199.79 - 213.88 |
2.409 times |
Fri 24 October 2025 |
199.62 (-1.05%) |
202.05 |
197.52 - 205.09 |
0.595 times |
Thu 23 October 2025 |
201.73 (-2.4%) |
207.00 |
201.20 - 207.70 |
0.5617 times |
Tue 21 October 2025 |
206.70 (0.68%) |
206.50 |
205.32 - 207.99 |
0.1599 times |
Mon 20 October 2025 |
205.31 (0.15%) |
207.99 |
201.38 - 208.99 |
0.5841 times |
Fri 17 October 2025 |
205.00 (-3.01%) |
211.90 |
195.42 - 212.10 |
2.145 times |
Thu 16 October 2025 |
211.37 (0.34%) |
210.10 |
209.88 - 216.25 |
0.548 times |
Wed 15 October 2025 |
210.65 (-1.14%) |
214.40 |
210.00 - 215.00 |
0.3859 times |
Tue 14 October 2025 |
213.07 (-1.1%) |
215.85 |
212.00 - 220.01 |
0.5759 times |
Weekly price and charts ShantiGold Strong weekly Stock price targets for ShantiGold SHANTIGOLD are 206.73 and 224.39 | Weekly Target 1 | 192.64 | | Weekly Target 2 | 203.16 | | Weekly Target 3 | 210.30333333333 | | Weekly Target 4 | 220.82 | | Weekly Target 5 | 227.96 |
Weekly price and volumes for Shanti Gold
| Date |
Closing |
Open |
Range |
Volume |
Wed 29 October 2025 |
213.67 (7.04%) |
199.80 |
199.79 - 217.45 |
0.9239 times |
Fri 24 October 2025 |
199.62 (-2.62%) |
207.99 |
197.52 - 208.99 |
0.3498 times |
Fri 17 October 2025 |
205.00 (-4.26%) |
215.00 |
195.42 - 221.50 |
0.9179 times |
Fri 10 October 2025 |
214.13 (0.3%) |
211.00 |
204.25 - 231.89 |
1.5881 times |
Fri 03 October 2025 |
213.50 (-2.21%) |
219.18 |
204.20 - 219.63 |
0.4387 times |
Fri 26 September 2025 |
218.33 (-1.92%) |
222.60 |
200.02 - 228.45 |
1.1468 times |
Fri 19 September 2025 |
222.60 (-0.45%) |
223.61 |
218.56 - 224.50 |
0.5311 times |
Fri 12 September 2025 |
223.61 (-3%) |
231.80 |
222.24 - 234.40 |
0.6493 times |
Fri 05 September 2025 |
230.53 (4.92%) |
219.72 |
219.50 - 244.78 |
1.5593 times |
Fri 29 August 2025 |
219.72 (-10.76%) |
246.47 |
215.69 - 247.00 |
1.895 times |
Fri 22 August 2025 |
246.22 (-0.52%) |
251.00 |
245.02 - 274.10 |
7.8069 times |

Monthly price and charts ShantiGold Strong monthly Stock price targets for ShantiGold SHANTIGOLD are 186.31 and 222.78 | Monthly Target 1 | 177.19 | | Monthly Target 2 | 195.43 | | Monthly Target 3 | 213.66 | | Monthly Target 4 | 231.9 | | Monthly Target 5 | 250.13 |
Monthly price and volumes Shanti Gold
| Date |
Closing |
Open |
Range |
Volume |
Wed 29 October 2025 |
213.67 (-0.1%) |
213.97 |
195.42 - 231.89 |
0.3463 times |
Tue 30 September 2025 |
213.89 (-2.65%) |
219.72 |
200.02 - 244.78 |
0.3658 times |
Fri 29 August 2025 |
219.72 (0%) |
227.55 |
215.69 - 274.10 |
2.2879 times |
Wed 29 October 2025 |
(0%) |
|
- |
0 times |

DMA SMA EMA moving averages of Shanti Gold SHANTIGOLD
DMA (daily moving average) of Shanti Gold SHANTIGOLD
| DMA period | DMA value | | 5 day DMA | 207.84 | | 12 day DMA | 208.89 | | 20 day DMA | 209.65 | | 35 day DMA | 214.56 | | 50 day DMA | 220.92 | | 100 day DMA | | | 150 day DMA | | | 200 day DMA | | EMA (exponential moving average) of Shanti Gold SHANTIGOLD
| EMA period | EMA current | EMA prev | EMA prev2 | | 5 day EMA | 210.09 | 208.3 | 206.57 | | 12 day EMA | 209.44 | 208.67 | 208.11 | | 20 day EMA | 211.11 | 210.84 | 210.74 | | 35 day EMA | 216.14 | 216.29 | 216.56 | | 50 day EMA | 221.64 | 221.97 | 222.39 |
SMA (simple moving average) of Shanti Gold SHANTIGOLD
| SMA period | SMA current | SMA prev | SMA prev2 | | 5 day SMA | 207.84 | 206.44 | 205.15 | | 12 day SMA | 208.89 | 208.93 | 208.68 | | 20 day SMA | 209.65 | 209.4 | 209.73 | | 35 day SMA | 214.56 | 215.08 | 215.62 | | 50 day SMA | 220.92 | 221.6 | 222.26 | | 100 day SMA | | 150 day SMA | | 200 day SMA |
|
|
