ShalimarPaints SHALPAINTS full analysis,charts,indicators,moving averages,SMA,DMA,EMA,ADX,MACD,RSIShalimar Paints SHALPAINTS WideScreen charts, DMA,SMA,EMA technical analysis, forecast prediction, by indicators ADX,MACD,RSI,CCI NSE stock exchange
operates under Furniture-Furnishing-Paints sector
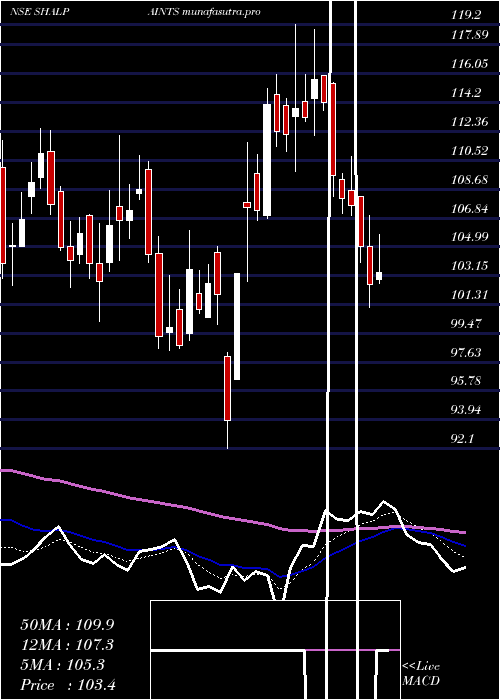
Daily price and charts and targets ShalimarPaints Strong Daily Stock price targets for ShalimarPaints SHALPAINTS are 75.99 and 78.16 | Daily Target 1 | 75.54 | | Daily Target 2 | 76.44 | | Daily Target 3 | 77.706666666667 | | Daily Target 4 | 78.61 | | Daily Target 5 | 79.88 |
Daily price and volume Shalimar Paints
| Date |
Closing |
Open |
Range |
Volume |
Tue 28 October 2025 |
77.35 (-1.12%) |
78.40 |
76.80 - 78.97 |
0.4475 times |
Mon 27 October 2025 |
78.23 (-1.04%) |
79.00 |
77.30 - 79.54 |
0.4652 times |
Fri 24 October 2025 |
79.05 (0.05%) |
79.01 |
78.71 - 79.59 |
0.3081 times |
Thu 23 October 2025 |
79.01 (-3.25%) |
81.66 |
78.10 - 81.66 |
0.8776 times |
Tue 21 October 2025 |
81.66 (1.05%) |
81.00 |
81.00 - 82.00 |
0.1661 times |
Mon 20 October 2025 |
80.81 (0.67%) |
81.45 |
80.03 - 82.70 |
0.8336 times |
Fri 17 October 2025 |
80.27 (0.99%) |
79.88 |
79.10 - 88.47 |
6.1085 times |
Thu 16 October 2025 |
79.48 (-0.81%) |
80.78 |
79.00 - 80.99 |
0.2725 times |
Wed 15 October 2025 |
80.13 (0.81%) |
79.60 |
79.49 - 80.79 |
0.2769 times |
Tue 14 October 2025 |
79.49 (-2.02%) |
81.99 |
78.80 - 81.99 |
0.244 times |
Mon 13 October 2025 |
81.13 (0.28%) |
81.31 |
79.45 - 82.29 |
0.5859 times |
Weekly price and charts ShalimarPaints Strong weekly Stock price targets for ShalimarPaints SHALPAINTS are 75.71 and 78.45 | Weekly Target 1 | 75.16 | | Weekly Target 2 | 76.25 | | Weekly Target 3 | 77.896666666667 | | Weekly Target 4 | 78.99 | | Weekly Target 5 | 80.64 |
Weekly price and volumes for Shalimar Paints
| Date |
Closing |
Open |
Range |
Volume |
Tue 28 October 2025 |
77.35 (-2.15%) |
79.00 |
76.80 - 79.54 |
0.116 times |
Fri 24 October 2025 |
79.05 (-1.52%) |
81.45 |
78.10 - 82.70 |
0.2778 times |
Fri 17 October 2025 |
80.27 (-0.78%) |
81.31 |
78.80 - 88.47 |
0.9518 times |
Fri 10 October 2025 |
80.90 (-4.02%) |
85.50 |
80.25 - 86.80 |
0.3425 times |
Fri 03 October 2025 |
84.29 (10.65%) |
77.29 |
76.20 - 87.48 |
1.802 times |
Fri 26 September 2025 |
76.18 (-11.27%) |
85.00 |
76.02 - 85.00 |
0.6282 times |
Fri 19 September 2025 |
85.86 (17.76%) |
73.49 |
72.82 - 88.71 |
4.4644 times |
Fri 12 September 2025 |
72.91 (0.45%) |
72.78 |
72.11 - 75.88 |
0.3579 times |
Fri 05 September 2025 |
72.58 (1.18%) |
72.26 |
70.57 - 75.69 |
0.5179 times |
Fri 29 August 2025 |
71.73 (-1.74%) |
73.70 |
71.11 - 78.40 |
0.5415 times |
Fri 22 August 2025 |
73.00 (3.93%) |
70.94 |
70.94 - 75.00 |
0.5894 times |
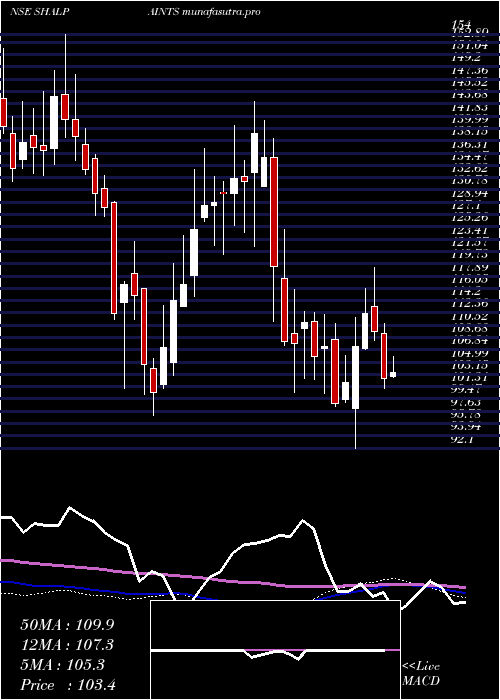
Monthly price and charts ShalimarPaints Strong monthly Stock price targets for ShalimarPaints SHALPAINTS are 71.24 and 82.91 | Monthly Target 1 | 69.2 | | Monthly Target 2 | 73.28 | | Monthly Target 3 | 80.873333333333 | | Monthly Target 4 | 84.95 | | Monthly Target 5 | 92.54 |
Monthly price and volumes Shalimar Paints
| Date |
Closing |
Open |
Range |
Volume |
Tue 28 October 2025 |
77.35 (-10.27%) |
86.70 |
76.80 - 88.47 |
0.5866 times |
Tue 30 September 2025 |
86.20 (20.17%) |
72.26 |
70.57 - 88.71 |
2.201 times |
Fri 29 August 2025 |
71.73 (-12.21%) |
81.71 |
69.66 - 82.99 |
0.7643 times |
Thu 31 July 2025 |
81.71 (-15.74%) |
97.97 |
80.66 - 99.49 |
0.7973 times |
Mon 30 June 2025 |
96.97 (-2.96%) |
100.45 |
94.37 - 107.76 |
1.2314 times |
Fri 30 May 2025 |
99.93 (-4.82%) |
104.99 |
95.50 - 107.00 |
0.7604 times |
Wed 30 April 2025 |
104.99 (6.36%) |
99.45 |
92.10 - 119.20 |
0.6827 times |
Fri 28 March 2025 |
98.71 (-8.46%) |
110.05 |
98.36 - 112.58 |
1.0963 times |
Fri 28 February 2025 |
107.83 (-22.54%) |
131.25 |
100.49 - 141.13 |
0.885 times |
Fri 31 January 2025 |
139.21 (10.55%) |
126.00 |
121.04 - 144.00 |
0.995 times |
Tue 31 December 2024 |
125.92 (17.51%) |
105.00 |
103.00 - 137.00 |
1.2434 times |

DMA SMA EMA moving averages of Shalimar Paints SHALPAINTS
DMA (daily moving average) of Shalimar Paints SHALPAINTS
| DMA period | DMA value | | 5 day DMA | 79.06 | | 12 day DMA | 79.79 | | 20 day DMA | 81.33 | | 35 day DMA | 79.47 | | 50 day DMA | 77.45 | | 100 day DMA | 84.7 | | 150 day DMA | 91.1 | | 200 day DMA | 98.59 | EMA (exponential moving average) of Shalimar Paints SHALPAINTS
| EMA period | EMA current | EMA prev | EMA prev2 | | 5 day EMA | 78.65 | 79.3 | 79.84 | | 12 day EMA | 79.64 | 80.06 | 80.39 | | 20 day EMA | 79.8 | 80.06 | 80.25 | | 35 day EMA | 78.79 | 78.87 | 78.91 | | 50 day EMA | 77.31 | 77.31 | 77.27 |
SMA (simple moving average) of Shalimar Paints SHALPAINTS
| SMA period | SMA current | SMA prev | SMA prev2 | | 5 day SMA | 79.06 | 79.75 | 80.16 | | 12 day SMA | 79.79 | 80.19 | 80.57 | | 20 day SMA | 81.33 | 81.27 | 81.27 | | 35 day SMA | 79.47 | 79.34 | 79.19 | | 50 day SMA | 77.45 | 77.34 | 77.24 | | 100 day SMA | 84.7 | 84.89 | 85.1 | | 150 day SMA | 91.1 | 91.29 | 91.45 | | 200 day SMA | 98.59 | 98.82 | 99.08 |
|
|
