250 SGBMAY26_GB full analysis,charts,indicators,moving averages,SMA,DMA,EMA,ADX,MACD,RSI2 50 SGBMAY26_GB WideScreen charts, DMA,SMA,EMA technical analysis, forecast prediction, by indicators ADX,MACD,RSI,CCI NSE stock exchange
Daily price and charts and targets 250 Strong Daily Stock price targets for 250 SGBMAY26_GB are 12235 and 12265 | Daily Target 1 | 12230 | | Daily Target 2 | 12240 | | Daily Target 3 | 12260 | | Daily Target 4 | 12270 | | Daily Target 5 | 12290 |
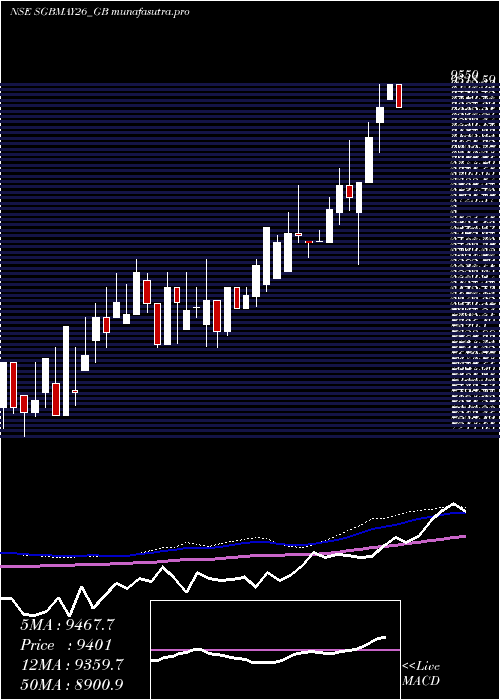
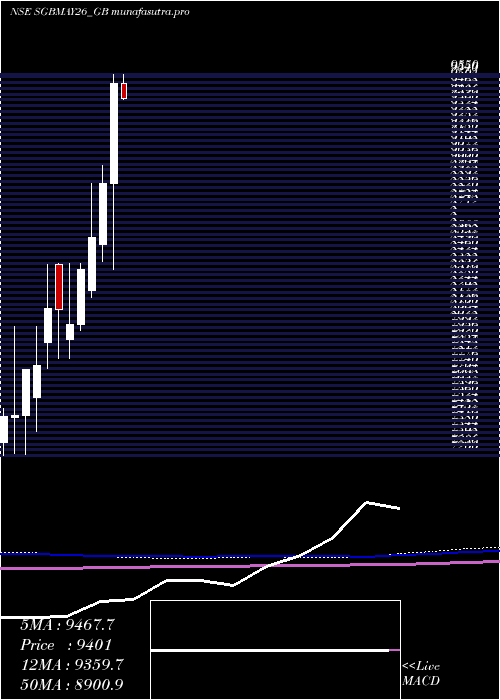
Daily price and volume 2 50
| Date |
Closing |
Open |
Range |
Volume |
Tue 28 October 2025 |
12250.00 (-1.05%) |
12250.03 |
12250.00 - 12280.00 |
0.6103 times |
Mon 27 October 2025 |
12380.00 (0.46%) |
12380.36 |
12380.00 - 12396.01 |
0.1408 times |
Fri 24 October 2025 |
12323.61 (-5.2%) |
13200.00 |
12301.00 - 13249.00 |
0.4851 times |
Thu 23 October 2025 |
13000.00 (-3.7%) |
12699.99 |
12302.11 - 13700.00 |
2.6604 times |
Tue 21 October 2025 |
13500.00 (1.5%) |
13500.00 |
13500.00 - 13500.00 |
0.0156 times |
Mon 20 October 2025 |
13300.01 (-2.32%) |
13275.89 |
13275.89 - 13502.00 |
0.8138 times |
Fri 17 October 2025 |
13616.30 (1.47%) |
13500.00 |
13500.00 - 14000.00 |
3.0047 times |
Thu 16 October 2025 |
13419.00 (-2.46%) |
13758.00 |
13419.00 - 13758.00 |
0.4382 times |
Wed 15 October 2025 |
13758.00 (-2.31%) |
13800.00 |
13500.00 - 13800.00 |
0.4851 times |
Tue 14 October 2025 |
14083.76 (5.1%) |
13420.00 |
13420.00 - 14110.00 |
1.3459 times |
Mon 13 October 2025 |
13400.00 (0.19%) |
13400.00 |
13400.00 - 14464.48 |
0.4069 times |

Weekly price and charts 250 Strong weekly Stock price targets for 250 SGBMAY26_GB are 12177 and 12323.01 | Weekly Target 1 | 12152.66 | | Weekly Target 2 | 12201.33 | | Weekly Target 3 | 12298.67 | | Weekly Target 4 | 12347.34 | | Weekly Target 5 | 12444.68 |
Weekly price and volumes for 2 50
| Date |
Closing |
Open |
Range |
Volume |
Tue 28 October 2025 |
12250.00 (-0.6%) |
12380.36 |
12250.00 - 12396.01 |
0.323 times |
Fri 24 October 2025 |
12323.61 (-9.49%) |
13275.89 |
12301.00 - 13700.00 |
1.7093 times |
Fri 17 October 2025 |
13616.30 (1.8%) |
13400.00 |
13400.00 - 14464.48 |
2.4428 times |
Fri 10 October 2025 |
13375.00 (8.65%) |
12699.99 |
12580.01 - 14499.00 |
1.1844 times |
Fri 03 October 2025 |
12310.44 (1.02%) |
12125.06 |
11881.34 - 12800.00 |
0.8345 times |
Fri 26 September 2025 |
12185.99 (3.45%) |
12074.50 |
11780.00 - 12300.00 |
1.0229 times |
Fri 19 September 2025 |
11780.00 (-1.74%) |
11900.00 |
11500.00 - 12501.00 |
0.9489 times |
Fri 12 September 2025 |
11988.00 (4.7%) |
12435.00 |
11501.00 - 13376.00 |
0.6528 times |
Fri 05 September 2025 |
11450.00 (4.19%) |
11150.00 |
11150.00 - 12480.00 |
0.6124 times |
Fri 29 August 2025 |
10990.00 (6.03%) |
10313.17 |
10311.13 - 10998.79 |
0.2692 times |
Fri 22 August 2025 |
10365.00 (-2.15%) |
10550.00 |
10260.01 - 10602.80 |
0.3365 times |
Monthly price and charts 250 Strong monthly Stock price targets for 250 SGBMAY26_GB are 11125.5 and 13374.5 | Monthly Target 1 | 10750.67 | | Monthly Target 2 | 11500.33 | | Monthly Target 3 | 12999.666666667 | | Monthly Target 4 | 13749.33 | | Monthly Target 5 | 15248.67 |
Monthly price and volumes 2 50
| Date |
Closing |
Open |
Range |
Volume |
Tue 28 October 2025 |
12250.00 (-3.95%) |
12753.44 |
12250.00 - 14499.00 |
1.0868 times |
Tue 30 September 2025 |
12753.44 (16.05%) |
11150.00 |
11150.00 - 13376.00 |
0.7406 times |
Fri 29 August 2025 |
10990.00 (9.9%) |
10000.00 |
9921.00 - 10998.79 |
0.3463 times |
Thu 31 July 2025 |
10000.00 (2.56%) |
9750.00 |
9521.10 - 10000.00 |
2.1117 times |
Mon 30 June 2025 |
9750.00 (2.1%) |
9400.00 |
9395.00 - 10100.00 |
1.5443 times |
Wed 28 May 2025 |
9549.00 (0.53%) |
9499.00 |
9063.50 - 9600.00 |
0.4107 times |
Wed 30 April 2025 |
9499.00 (6.97%) |
8881.00 |
8351.00 - 9550.00 |
0.9668 times |
Fri 28 March 2025 |
8880.00 (3.92%) |
8505.00 |
8400.01 - 8991.00 |
0.901 times |
Fri 28 February 2025 |
8545.00 (2.35%) |
8222.50 |
8176.11 - 8879.97 |
1.4268 times |
Fri 31 January 2025 |
8348.99 (4.23%) |
8010.00 |
7974.00 - 8384.99 |
0.4651 times |
Tue 31 December 2024 |
8010.00 (-1.11%) |
7920.00 |
7800.00 - 8384.99 |
0.877 times |
DMA SMA EMA moving averages of 2 50 SGBMAY26_GB
DMA (daily moving average) of 2 50 SGBMAY26_GB
| DMA period | DMA value | | 5 day DMA | 12690.72 | | 12 day DMA | 13200.47 | | 20 day DMA | 13068.16 | | 35 day DMA | 12662.72 | | 50 day DMA | 12055.24 | | 100 day DMA | 10949.27 | | 150 day DMA | 10315.01 | | 200 day DMA | 9802.61 | EMA (exponential moving average) of 2 50 SGBMAY26_GB
| EMA period | EMA current | EMA prev | EMA prev2 | | 5 day EMA | 12608.53 | 12787.77 | 12991.62 | | 12 day EMA | 12897.91 | 13015.67 | 13131.21 | | 20 day EMA | 12846.93 | 12909.74 | 12965.48 | | 35 day EMA | 12464.66 | 12477.3 | 12483.03 | | 50 day EMA | 11954.29 | 11942.23 | 11924.37 |
SMA (simple moving average) of 2 50 SGBMAY26_GB
| SMA period | SMA current | SMA prev | SMA prev2 | | 5 day SMA | 12690.72 | 12900.72 | 13147.98 | | 12 day SMA | 13200.47 | 13289.33 | 13389.29 | | 20 day SMA | 13068.16 | 13064.96 | 13057.21 | | 35 day SMA | 12662.72 | 12637.23 | 12607.95 | | 50 day SMA | 12055.24 | 12015.83 | 11970.23 | | 100 day SMA | 10949.27 | 10919.97 | 10891.67 | | 150 day SMA | 10315.01 | 10290 | 10263.64 | | 200 day SMA | 9802.61 | 9782.36 | 9760.61 |
|
|
