250 SGBJUN27_GB full analysis,charts,indicators,moving averages,SMA,DMA,EMA,ADX,MACD,RSI2 50 SGBJUN27_GB WideScreen charts, DMA,SMA,EMA technical analysis, forecast prediction, by indicators ADX,MACD,RSI,CCI NSE stock exchange
Daily price and charts and targets 250 Strong Daily Stock price targets for 250 SGBJUN27_GB are 11126.51 and 12125.51 | Daily Target 1 | 10918 | | Daily Target 2 | 11335.01 | | Daily Target 3 | 11917.003333333 | | Daily Target 4 | 12334.01 | | Daily Target 5 | 12916 |
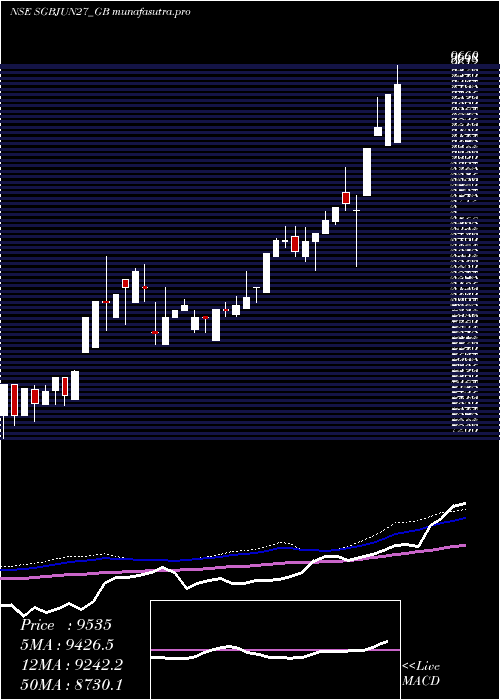
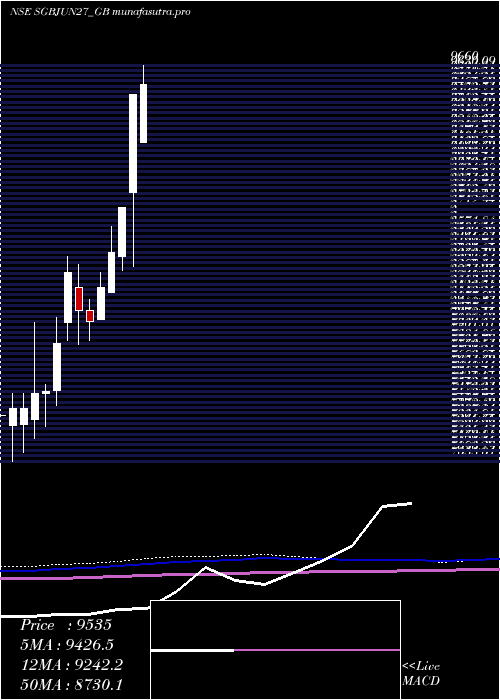
Daily price and volume 2 50
| Date |
Closing |
Open |
Range |
Volume |
Tue 28 October 2025 |
11752.01 (-5.98%) |
12499.00 |
11500.00 - 12499.00 |
2.2254 times |
Fri 24 October 2025 |
12499.00 (0.26%) |
12499.01 |
12499.00 - 12499.01 |
0.0867 times |
Thu 23 October 2025 |
12466.00 (-3.61%) |
12540.00 |
12366.00 - 12540.00 |
1.763 times |
Tue 21 October 2025 |
12933.50 (-2.02%) |
13199.60 |
12711.00 - 13199.60 |
0.6936 times |
Mon 20 October 2025 |
13200.00 (-2.94%) |
13200.00 |
13200.00 - 13200.00 |
0.4046 times |
Fri 17 October 2025 |
13599.99 (3.81%) |
13675.00 |
13599.99 - 13680.00 |
0.4624 times |
Thu 16 October 2025 |
13101.00 (-2.59%) |
13450.01 |
13100.00 - 13450.01 |
0.3468 times |
Wed 15 October 2025 |
13449.99 (-0.16%) |
13450.00 |
13449.99 - 13450.00 |
1.8786 times |
Tue 14 October 2025 |
13472.02 (1.22%) |
13500.00 |
13301.01 - 13525.00 |
1.3295 times |
Mon 13 October 2025 |
13310.20 (-1.04%) |
13450.00 |
13201.00 - 13450.00 |
0.8092 times |
Thu 09 October 2025 |
13450.00 (2.16%) |
13400.00 |
13300.00 - 13450.00 |
3.1503 times |

Weekly price and charts 250 Strong weekly Stock price targets for 250 SGBJUN27_GB are 11126.51 and 12125.51 | Weekly Target 1 | 10918 | | Weekly Target 2 | 11335.01 | | Weekly Target 3 | 11917.003333333 | | Weekly Target 4 | 12334.01 | | Weekly Target 5 | 12916 |
Weekly price and volumes for 2 50
| Date |
Closing |
Open |
Range |
Volume |
Tue 28 October 2025 |
11752.01 (-5.98%) |
12499.00 |
11500.00 - 12499.00 |
0.5199 times |
Fri 24 October 2025 |
12499.00 (-8.1%) |
13200.00 |
12366.00 - 13200.00 |
0.6887 times |
Fri 17 October 2025 |
13599.99 (1.12%) |
13450.00 |
13100.00 - 13680.00 |
1.1276 times |
Thu 09 October 2025 |
13450.00 (5.09%) |
12350.06 |
12350.06 - 13450.00 |
3.707 times |
Fri 03 October 2025 |
12799.00 (5.78%) |
12300.00 |
12150.00 - 12799.99 |
0.108 times |
Fri 26 September 2025 |
12100.00 (4.31%) |
11800.00 |
11717.09 - 12221.30 |
0.4794 times |
Thu 18 September 2025 |
11600.01 (-2.11%) |
11834.89 |
11511.30 - 12098.99 |
0.5672 times |
Fri 12 September 2025 |
11849.50 (0.63%) |
11915.77 |
10925.01 - 12000.00 |
0.5064 times |
Fri 05 September 2025 |
11774.97 (9.53%) |
10812.73 |
10812.73 - 11774.97 |
1.1614 times |
Fri 29 August 2025 |
10750.00 (4.57%) |
10499.00 |
10399.00 - 10750.00 |
1.1344 times |
Fri 22 August 2025 |
10280.00 (-0.08%) |
10297.00 |
10200.00 - 10454.00 |
0.817 times |
Monthly price and charts 250 Strong monthly Stock price targets for 250 SGBJUN27_GB are 10536.01 and 12716.01 | Monthly Target 1 | 10130.67 | | Monthly Target 2 | 10941.34 | | Monthly Target 3 | 12310.67 | | Monthly Target 4 | 13121.34 | | Monthly Target 5 | 14490.67 |
Monthly price and volumes 2 50
| Date |
Closing |
Open |
Range |
Volume |
Tue 28 October 2025 |
11752.01 (-3.28%) |
12205.00 |
11500.00 - 13680.00 |
1.9404 times |
Mon 29 September 2025 |
12150.00 (13.02%) |
10812.73 |
10812.73 - 12300.00 |
0.8967 times |
Fri 29 August 2025 |
10750.00 (7.66%) |
10100.00 |
9915.00 - 10750.00 |
1.5687 times |
Thu 31 July 2025 |
9985.00 (2.83%) |
9780.00 |
9601.00 - 10000.00 |
1.5125 times |
Mon 30 June 2025 |
9710.00 (2.74%) |
9420.00 |
9400.00 - 10000.00 |
0.6655 times |
Wed 28 May 2025 |
9451.11 (-0.19%) |
9150.00 |
9100.00 - 9700.00 |
0.4797 times |
Mon 28 April 2025 |
9469.00 (8.55%) |
8825.01 |
8335.11 - 9469.00 |
1.1106 times |
Fri 28 March 2025 |
8723.00 (3.46%) |
8400.00 |
8307.03 - 8723.00 |
0.6288 times |
Fri 28 February 2025 |
8431.27 (2.82%) |
8165.01 |
8165.01 - 8600.00 |
0.4818 times |
Fri 31 January 2025 |
8200.00 (2.79%) |
7986.60 |
7985.00 - 8299.00 |
0.7152 times |
Tue 31 December 2024 |
7977.27 (-0.85%) |
8045.35 |
7850.00 - 8120.00 |
0.8708 times |
DMA SMA EMA moving averages of 2 50 SGBJUN27_GB
DMA (daily moving average) of 2 50 SGBJUN27_GB
| DMA period | DMA value | | 5 day DMA | 12570.1 | | 12 day DMA | 13033.33 | | 20 day DMA | 12769.56 | | 35 day DMA | 12336.39 | | 50 day DMA | 11751.57 | | 100 day DMA | 10741.23 | | 150 day DMA | 10040.44 | | 200 day DMA | 9546.77 | EMA (exponential moving average) of 2 50 SGBJUN27_GB
| EMA period | EMA current | EMA prev | EMA prev2 | | 5 day EMA | 12447.5 | 12795.19 | 12943.26 | | 12 day EMA | 12712.64 | 12887.24 | 12957.8 | | 20 day EMA | 12620.4 | 12711.77 | 12734.16 | | 35 day EMA | 12206.29 | 12233.04 | 12217.38 | | 50 day EMA | 11686.67 | 11684 | 11650.75 |
SMA (simple moving average) of 2 50 SGBJUN27_GB
| SMA period | SMA current | SMA prev | SMA prev2 | | 5 day SMA | 12570.1 | 12939.7 | 13060.1 | | 12 day SMA | 13033.33 | 13133.02 | 13152.6 | | 20 day SMA | 12769.56 | 12786.96 | 12752.01 | | 35 day SMA | 12336.39 | 12318.76 | 12268.79 | | 50 day SMA | 11751.57 | 11716.35 | 11668.55 | | 100 day SMA | 10741.23 | 10719.06 | 10688.07 | | 150 day SMA | 10040.44 | 10015.94 | 9986.45 | | 200 day SMA | 9546.77 | 9530.01 | 9508.59 |
|
|
