25 SGBJU29III_GB full analysis,charts,indicators,moving averages,SMA,DMA,EMA,ADX,MACD,RSI2 5 SGBJU29III_GB WideScreen charts, DMA,SMA,EMA technical analysis, forecast prediction, by indicators ADX,MACD,RSI,CCI NSE stock exchange
Daily price and charts and targets 25 Strong Daily Stock price targets for 25 SGBJU29III_GB are 11900.01 and 12335.01 | Daily Target 1 | 11776.67 | | Daily Target 2 | 12023.34 | | Daily Target 3 | 12211.67 | | Daily Target 4 | 12458.34 | | Daily Target 5 | 12646.67 |
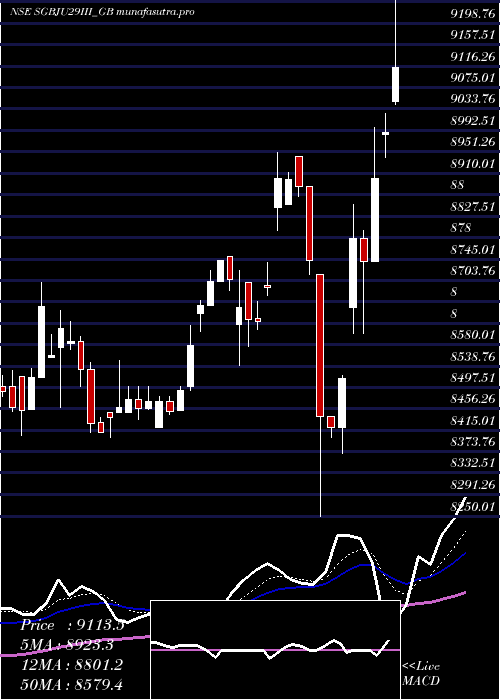
Daily price and volume 2 5
| Date |
Closing |
Open |
Range |
Volume |
Wed 29 October 2025 |
12270.01 (3.6%) |
12349.00 |
11965.00 - 12400.00 |
0.6162 times |
Tue 28 October 2025 |
11843.11 (-3.79%) |
12128.00 |
11811.15 - 12280.00 |
0.7901 times |
Mon 27 October 2025 |
12310.01 (-0.77%) |
12598.99 |
12305.56 - 12598.99 |
0.9854 times |
Fri 24 October 2025 |
12405.11 (-0.98%) |
12305.56 |
12201.00 - 12500.00 |
1.1959 times |
Thu 23 October 2025 |
12528.02 (-5.23%) |
12889.49 |
12300.00 - 12889.49 |
3.6699 times |
Tue 21 October 2025 |
13220.00 (0.14%) |
13202.01 |
13001.00 - 13300.00 |
0.1434 times |
Mon 20 October 2025 |
13201.96 (-3.14%) |
13630.63 |
13151.00 - 13630.63 |
0.9243 times |
Fri 17 October 2025 |
13630.64 (0.75%) |
13600.00 |
13525.00 - 13700.00 |
0.1922 times |
Thu 16 October 2025 |
13529.28 (0.01%) |
13679.00 |
13450.00 - 13679.01 |
0.7047 times |
Wed 15 October 2025 |
13527.93 (-0.02%) |
13531.02 |
13412.00 - 13729.99 |
0.7779 times |
Tue 14 October 2025 |
13530.63 (0.43%) |
13501.01 |
13500.00 - 13749.99 |
0.2837 times |
Weekly price and charts 25 Strong weekly Stock price targets for 25 SGBJU29III_GB are 11646.66 and 12434.5 | Weekly Target 1 | 11438.88 | | Weekly Target 2 | 11854.44 | | Weekly Target 3 | 12226.716666667 | | Weekly Target 4 | 12642.28 | | Weekly Target 5 | 13014.56 |
Weekly price and volumes for 2 5
| Date |
Closing |
Open |
Range |
Volume |
Wed 29 October 2025 |
12270.01 (-1.09%) |
12598.99 |
11811.15 - 12598.99 |
0.6963 times |
Fri 24 October 2025 |
12405.11 (-8.99%) |
13630.63 |
12201.00 - 13630.63 |
1.7275 times |
Fri 17 October 2025 |
13630.64 (2.69%) |
13539.21 |
13305.55 - 13749.99 |
0.699 times |
Fri 10 October 2025 |
13273.74 (5.46%) |
12699.00 |
12616.00 - 13650.00 |
1.6431 times |
Fri 03 October 2025 |
12587.02 (3.43%) |
12390.00 |
12250.10 - 12850.00 |
1.4637 times |
Fri 26 September 2025 |
12170.00 (3.09%) |
11950.00 |
11902.00 - 12285.00 |
0.7523 times |
Fri 19 September 2025 |
11805.00 (-1.63%) |
12000.00 |
11770.00 - 12000.00 |
0.3482 times |
Fri 12 September 2025 |
12000.00 (2.11%) |
11840.00 |
11800.00 - 12550.00 |
1.0187 times |
Fri 05 September 2025 |
11752.28 (7.62%) |
10920.25 |
10865.00 - 11882.70 |
1.2337 times |
Fri 29 August 2025 |
10920.25 (5.29%) |
10371.24 |
10336.58 - 10950.00 |
0.4174 times |
Fri 22 August 2025 |
10371.24 (0.89%) |
10280.00 |
10241.00 - 10465.00 |
0.572 times |

Monthly price and charts 25 Strong monthly Stock price targets for 25 SGBJU29III_GB are 11071.16 and 13010 | Monthly Target 1 | 10671.54 | | Monthly Target 2 | 11470.78 | | Monthly Target 3 | 12610.383333333 | | Monthly Target 4 | 13409.62 | | Monthly Target 5 | 14549.22 |
Monthly price and volumes 2 5
| Date |
Closing |
Open |
Range |
Volume |
Wed 29 October 2025 |
12270.01 (-0.96%) |
12400.00 |
11811.15 - 13749.99 |
1.1108 times |
Tue 30 September 2025 |
12389.41 (13.45%) |
10920.25 |
10865.00 - 12550.00 |
0.8018 times |
Fri 29 August 2025 |
10920.25 (10.31%) |
9924.99 |
9881.00 - 10950.00 |
0.5216 times |
Thu 31 July 2025 |
9900.00 (2.18%) |
9671.00 |
9671.00 - 10010.00 |
1.1255 times |
Mon 30 June 2025 |
9688.42 (2.9%) |
9415.49 |
9415.49 - 9979.99 |
1.2371 times |
Fri 30 May 2025 |
9415.49 (2.4%) |
9191.00 |
9050.01 - 9448.00 |
0.6652 times |
Wed 30 April 2025 |
9194.75 (5.8%) |
8843.90 |
8250.01 - 9293.00 |
2.3789 times |
Fri 28 March 2025 |
8690.50 (3.1%) |
8430.00 |
8401.25 - 8749.00 |
0.9243 times |
Fri 28 February 2025 |
8428.79 (2.31%) |
8271.00 |
8255.00 - 8700.00 |
0.7281 times |
Fri 31 January 2025 |
8238.77 (2.34%) |
8050.00 |
8011.00 - 8350.00 |
0.5067 times |
Tue 31 December 2024 |
8050.10 (-0.39%) |
8053.00 |
8000.00 - 8199.00 |
0.5428 times |

DMA SMA EMA moving averages of 2 5 SGBJU29III_GB
DMA (daily moving average) of 2 5 SGBJU29III_GB
| DMA period | DMA value | | 5 day DMA | 12271.25 | | 12 day DMA | 12955.79 | | 20 day DMA | 12952.14 | | 35 day DMA | 12554.46 | | 50 day DMA | 12064.01 | | 100 day DMA | 10972.5 | | 150 day DMA | 10344.7 | | 200 day DMA | 9845.59 | EMA (exponential moving average) of 2 5 SGBJU29III_GB
| EMA period | EMA current | EMA prev | EMA prev2 | | 5 day EMA | 12353.1 | 12394.64 | 12670.37 | | 12 day EMA | 12664.36 | 12736.04 | 12898.33 | | 20 day EMA | 12673.72 | 12716.2 | 12808.06 | | 35 day EMA | 12379.88 | 12386.35 | 12418.33 | | 50 day EMA | 11935.11 | 11921.45 | 11924.65 |
SMA (simple moving average) of 2 5 SGBJU29III_GB
| SMA period | SMA current | SMA prev | SMA prev2 | | 5 day SMA | 12271.25 | 12461.25 | 12733.02 | | 12 day SMA | 12955.79 | 13039.44 | 13178.25 | | 20 day SMA | 12952.14 | 12955.81 | 12972.16 | | 35 day SMA | 12554.46 | 12549.46 | 12546.86 | | 50 day SMA | 12064.01 | 12024.2 | 11992.09 | | 100 day SMA | 10972.5 | 10946.63 | 10924.61 | | 150 day SMA | 10344.7 | 10320.59 | 10298.83 | | 200 day SMA | 9845.59 | 9824.79 | 9806.35 |
|
|
