SecRed SFLZC26A_ZC full analysis,charts,indicators,moving averages,SMA,DMA,EMA,ADX,MACD,RSISec Red SFLZC26A_ZC WideScreen charts, DMA,SMA,EMA technical analysis, forecast prediction, by indicators ADX,MACD,RSI,CCI NSE stock exchange
Daily price and charts and targets SecRed Strong Daily Stock price targets for SecRed SFLZC26A_ZC are 1789.8 and 1789.8 | Daily Target 1 | 1789.8 | | Daily Target 2 | 1789.8 | | Daily Target 3 | 1789.8 | | Daily Target 4 | 1789.8 | | Daily Target 5 | 1789.8 |
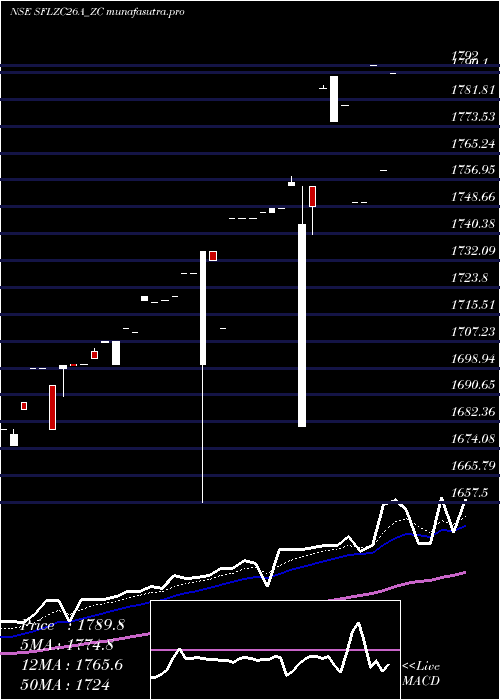
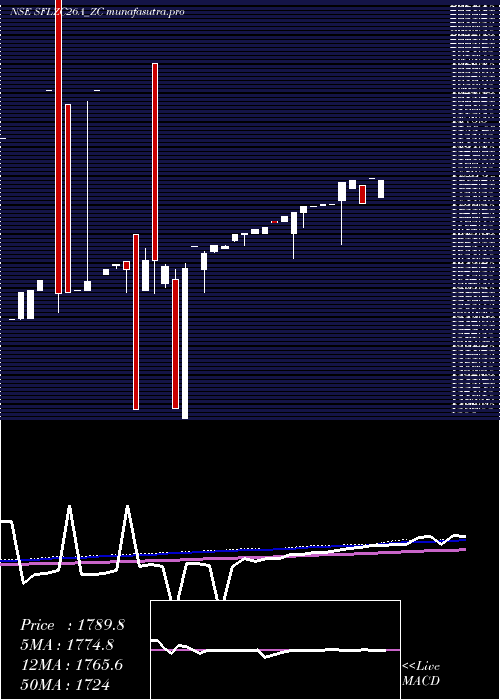
Daily price and volume Sec Red
| Date |
Closing |
Open |
Range |
Volume |
Fri 24 October 2025 |
1789.80 (1.69%) |
1789.80 |
1789.80 - 1789.80 |
0.1821 times |
Thu 23 October 2025 |
1760.00 (-1.79%) |
1760.00 |
1760.00 - 1760.00 |
0.0911 times |
Fri 17 October 2025 |
1792.00 (2.4%) |
1792.00 |
1792.00 - 1792.00 |
0.6831 times |
Fri 03 October 2025 |
1750.00 (0%) |
1750.00 |
1750.00 - 1750.00 |
0.0091 times |
Wed 17 September 2025 |
1750.00 (-1.69%) |
1750.00 |
1750.00 - 1750.00 |
0.0091 times |
Mon 15 September 2025 |
1780.00 (-0.5%) |
1780.00 |
1780.00 - 1780.00 |
2.5865 times |
Thu 11 September 2025 |
1789.00 (0.22%) |
1775.00 |
1775.00 - 1789.00 |
2.3679 times |
Fri 22 August 2025 |
1785.00 (2.08%) |
1785.00 |
1785.00 - 1786.00 |
2.0492 times |
Thu 21 August 2025 |
1748.62 (0.3%) |
1755.00 |
1740.01 - 1755.00 |
0.6193 times |
Wed 20 August 2025 |
1743.34 (-0.73%) |
1681.01 |
1681.01 - 1755.00 |
1.4026 times |
Tue 19 August 2025 |
1756.18 (0.47%) |
1755.10 |
1755.10 - 1757.90 |
1.184 times |
Weekly price and charts SecRed Strong weekly Stock price targets for SecRed SFLZC26A_ZC are 1774.9 and 1804.7 | Weekly Target 1 | 1750.07 | | Weekly Target 2 | 1769.93 | | Weekly Target 3 | 1779.8666666667 | | Weekly Target 4 | 1799.73 | | Weekly Target 5 | 1809.67 |
Weekly price and volumes for Sec Red
| Date |
Closing |
Open |
Range |
Volume |
Fri 24 October 2025 |
1789.80 (-0.12%) |
1760.00 |
1760.00 - 1789.80 |
0.1546 times |
Fri 17 October 2025 |
1792.00 (2.4%) |
1792.00 |
1792.00 - 1792.00 |
0.3864 times |
Fri 03 October 2025 |
1750.00 (-2.18%) |
1780.00 |
1750.00 - 1780.00 |
1.4735 times |
Thu 11 September 2025 |
1789.00 (0.22%) |
1775.00 |
1775.00 - 1789.00 |
1.3395 times |
Fri 22 August 2025 |
1785.00 (2.12%) |
1755.10 |
1681.01 - 1786.00 |
2.9727 times |
Tue 29 July 2025 |
1748.00 (0%) |
1748.00 |
1748.00 - 1748.00 |
0.2009 times |
Thu 24 July 2025 |
1748.00 (0.17%) |
1747.00 |
1747.00 - 1748.00 |
0.1803 times |
Thu 10 July 2025 |
1745.00 (0%) |
1745.00 |
1745.00 - 1745.00 |
1.9268 times |
Wed 25 June 2025 |
1745.00 (0.58%) |
1735.00 |
1711.00 - 1745.00 |
1.185 times |
Wed 11 June 2025 |
1735.00 (0.41%) |
1700.00 |
1657.50 - 1735.00 |
0.1803 times |
Fri 30 May 2025 |
1728.00 (0.52%) |
1719.90 |
1719.90 - 1728.00 |
0.9222 times |
Monthly price and charts SecRed Strong monthly Stock price targets for SecRed SFLZC26A_ZC are 1769.9 and 1811.9 | Monthly Target 1 | 1735.27 | | Monthly Target 2 | 1762.53 | | Monthly Target 3 | 1777.2666666667 | | Monthly Target 4 | 1804.53 | | Monthly Target 5 | 1819.27 |
Monthly price and volumes Sec Red
| Date |
Closing |
Open |
Range |
Volume |
Fri 24 October 2025 |
1789.80 (2.27%) |
1750.00 |
1750.00 - 1792.00 |
0.1627 times |
Wed 17 September 2025 |
1750.00 (-1.96%) |
1775.00 |
1750.00 - 1789.00 |
0.8365 times |
Fri 22 August 2025 |
1785.00 (2.12%) |
1755.10 |
1681.01 - 1786.00 |
0.8856 times |
Tue 29 July 2025 |
1748.00 (0.17%) |
1745.00 |
1745.00 - 1748.00 |
0.6876 times |
Wed 25 June 2025 |
1745.00 (0.98%) |
1700.00 |
1657.50 - 1745.00 |
0.4068 times |
Fri 30 May 2025 |
1728.00 (1.53%) |
1706.90 |
1700.00 - 1728.00 |
1.1681 times |
Wed 30 April 2025 |
1702.00 (1.32%) |
1675.00 |
1675.00 - 1705.00 |
1.7559 times |
Fri 21 March 2025 |
1679.90 (0.83%) |
1670.00 |
1669.00 - 1679.90 |
1.0898 times |
Tue 18 February 2025 |
1666.00 (1.46%) |
1679.00 |
1601.75 - 1679.00 |
0.4651 times |
Thu 23 January 2025 |
1642.00 (2.63%) |
1918.00 |
1390.00 - 1918.00 |
2.5418 times |
Tue 31 December 2024 |
1600.00 (-2.44%) |
1698.00 |
1405.00 - 1985.00 |
0.462 times |

DMA SMA EMA moving averages of Sec Red SFLZC26A_ZC
DMA (daily moving average) of Sec Red SFLZC26A_ZC
| DMA period | DMA value | | 5 day DMA | 1768.36 | | 12 day DMA | 1766 | | 20 day DMA | 1755 | | 35 day DMA | 1735.81 | | 50 day DMA | 1711.85 | | 100 day DMA | 1684.28 | | 150 day DMA | | | 200 day DMA | | EMA (exponential moving average) of Sec Red SFLZC26A_ZC
| EMA period | EMA current | EMA prev | EMA prev2 | | 5 day EMA | 1774.75 | 1767.23 | 1770.85 | | 12 day EMA | 1765.67 | 1761.29 | 1761.52 | | 20 day EMA | 1755.84 | 1752.27 | 1751.46 | | 35 day EMA | 1739.06 | 1736.07 | 1734.66 | | 50 day EMA | 1721.58 | 1718.8 | 1717.12 |
SMA (simple moving average) of Sec Red SFLZC26A_ZC
| SMA period | SMA current | SMA prev | SMA prev2 | | 5 day SMA | 1768.36 | 1766.4 | 1772.2 | | 12 day SMA | 1766 | 1762.51 | 1761.43 | | 20 day SMA | 1755 | 1751.91 | 1750.31 | | 35 day SMA | 1735.81 | 1733.21 | 1731.46 | | 50 day SMA | 1711.85 | 1708.95 | 1706.85 | | 100 day SMA | 1684.28 | | 150 day SMA | | 200 day SMA |
|
|
