SheelaFoam SFL full analysis,charts,indicators,moving averages,SMA,DMA,EMA,ADX,MACD,RSISheela Foam SFL WideScreen charts, DMA,SMA,EMA technical analysis, forecast prediction, by indicators ADX,MACD,RSI,CCI NSE stock exchange
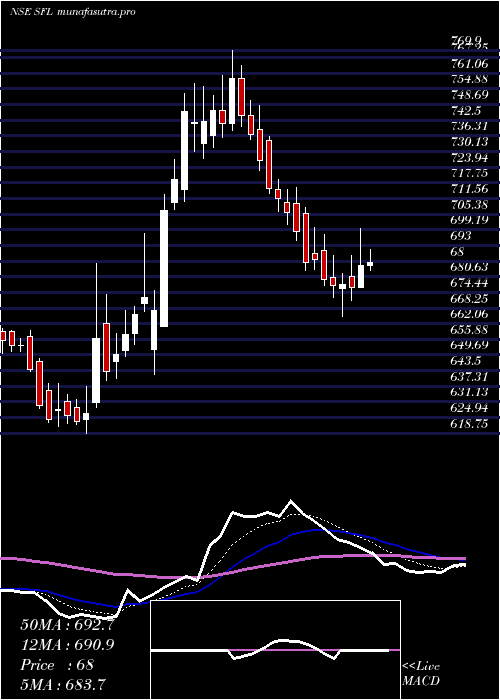
Daily price and charts and targets SheelaFoam Strong Daily Stock price targets for SheelaFoam SFL are 672.23 and 688.33 | Daily Target 1 | 659.62 | | Daily Target 2 | 668.73 | | Daily Target 3 | 675.71666666667 | | Daily Target 4 | 684.83 | | Daily Target 5 | 691.82 |
Daily price and volume Sheela Foam
| Date |
Closing |
Open |
Range |
Volume |
Wed 29 October 2025 |
677.85 (1.47%) |
668.50 |
666.60 - 682.70 |
0.7165 times |
Tue 28 October 2025 |
668.00 (-1.21%) |
681.50 |
666.55 - 681.50 |
0.4442 times |
Mon 27 October 2025 |
676.20 (0.29%) |
680.00 |
662.65 - 688.00 |
0.9374 times |
Fri 24 October 2025 |
674.25 (-0.22%) |
675.75 |
670.05 - 677.10 |
0.5334 times |
Thu 23 October 2025 |
675.75 (-0.46%) |
685.50 |
674.05 - 685.50 |
1.0836 times |
Tue 21 October 2025 |
678.85 (1.68%) |
674.10 |
671.05 - 683.00 |
0.4194 times |
Mon 20 October 2025 |
667.65 (0.03%) |
679.00 |
661.50 - 679.00 |
0.6455 times |
Fri 17 October 2025 |
667.45 (-0.43%) |
676.00 |
660.40 - 676.00 |
1.0386 times |
Thu 16 October 2025 |
670.30 (-0.49%) |
676.30 |
668.20 - 676.65 |
2.962 times |
Wed 15 October 2025 |
673.60 (0.56%) |
671.45 |
666.00 - 686.00 |
1.2193 times |
Tue 14 October 2025 |
669.85 (-1.24%) |
685.50 |
661.80 - 685.50 |
1.3148 times |
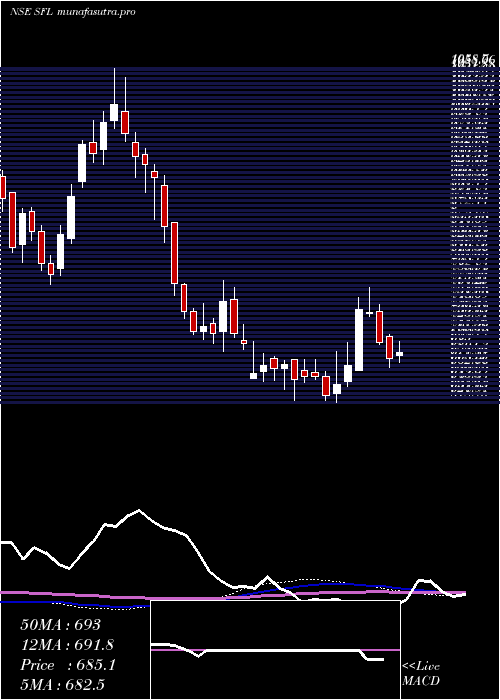
Weekly price and charts SheelaFoam Strong weekly Stock price targets for SheelaFoam SFL are 657.58 and 682.93 | Weekly Target 1 | 650.82 | | Weekly Target 2 | 664.33 | | Weekly Target 3 | 676.16666666667 | | Weekly Target 4 | 689.68 | | Weekly Target 5 | 701.52 |
Weekly price and volumes for Sheela Foam
| Date |
Closing |
Open |
Range |
Volume |
Wed 29 October 2025 |
677.85 (0.53%) |
680.00 |
662.65 - 688.00 |
0.2578 times |
Fri 24 October 2025 |
674.25 (1.02%) |
679.00 |
661.50 - 685.50 |
0.3295 times |
Fri 17 October 2025 |
667.45 (-2%) |
682.00 |
660.40 - 689.00 |
4.8362 times |
Fri 10 October 2025 |
681.10 (0.68%) |
676.50 |
654.30 - 692.00 |
0.6666 times |
Fri 03 October 2025 |
676.50 (1.45%) |
670.20 |
659.70 - 682.00 |
0.235 times |
Fri 26 September 2025 |
666.85 (-2.06%) |
680.00 |
664.85 - 701.00 |
0.4075 times |
Fri 19 September 2025 |
680.85 (-7.65%) |
737.30 |
676.50 - 742.95 |
0.8727 times |
Fri 12 September 2025 |
737.25 (2.8%) |
713.65 |
710.50 - 754.00 |
0.8495 times |
Fri 05 September 2025 |
717.20 (3.63%) |
694.85 |
694.85 - 744.50 |
0.654 times |
Fri 29 August 2025 |
692.10 (-1.31%) |
704.85 |
685.40 - 743.00 |
0.8912 times |
Fri 22 August 2025 |
701.30 (4.28%) |
675.00 |
671.05 - 715.00 |
0.2824 times |
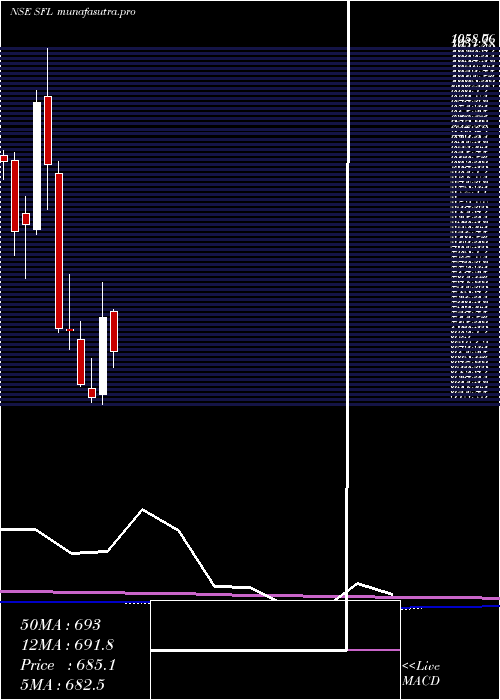
Monthly price and charts SheelaFoam Strong monthly Stock price targets for SheelaFoam SFL are 666.08 and 703.78 | Monthly Target 1 | 637.02 | | Monthly Target 2 | 657.43 | | Monthly Target 3 | 674.71666666667 | | Monthly Target 4 | 695.13 | | Monthly Target 5 | 712.42 |
Monthly price and volumes Sheela Foam
| Date |
Closing |
Open |
Range |
Volume |
Wed 29 October 2025 |
677.85 (2.16%) |
666.15 |
654.30 - 692.00 |
1.7794 times |
Tue 30 September 2025 |
663.50 (-4.13%) |
694.85 |
660.20 - 754.00 |
0.8318 times |
Fri 29 August 2025 |
692.10 (4.51%) |
667.50 |
660.00 - 743.00 |
0.6963 times |
Thu 31 July 2025 |
662.25 (-8.86%) |
734.50 |
652.40 - 736.00 |
0.6689 times |
Mon 30 June 2025 |
726.65 (15.7%) |
631.15 |
618.75 - 769.90 |
2.295 times |
Fri 30 May 2025 |
628.05 (-2.52%) |
638.50 |
621.10 - 676.00 |
0.9378 times |
Wed 30 April 2025 |
644.30 (-9.25%) |
700.00 |
642.00 - 721.85 |
0.7483 times |
Fri 28 March 2025 |
710.00 (-0.39%) |
712.10 |
686.50 - 779.00 |
0.7472 times |
Fri 28 February 2025 |
712.75 (-22.14%) |
904.15 |
708.00 - 918.40 |
0.4672 times |
Fri 31 January 2025 |
915.45 (-7.67%) |
999.55 |
860.00 - 1058.70 |
0.828 times |
Tue 31 December 2024 |
991.55 (17.94%) |
835.00 |
828.55 - 1007.00 |
1.3921 times |
DMA SMA EMA moving averages of Sheela Foam SFL
DMA (daily moving average) of Sheela Foam SFL
| DMA period | DMA value | | 5 day DMA | 674.41 | | 12 day DMA | 673.17 | | 20 day DMA | 671.88 | | 35 day DMA | 684.8 | | 50 day DMA | 692.12 | | 100 day DMA | 690.94 | | 150 day DMA | 683.45 | | 200 day DMA | 718.37 | EMA (exponential moving average) of Sheela Foam SFL
| EMA period | EMA current | EMA prev | EMA prev2 | | 5 day EMA | 674.24 | 672.43 | 674.64 | | 12 day EMA | 673.82 | 673.09 | 674.02 | | 20 day EMA | 675.61 | 675.37 | 676.15 | | 35 day EMA | 681.45 | 681.66 | 682.46 | | 50 day EMA | 688.69 | 689.13 | 689.99 |
SMA (simple moving average) of Sheela Foam SFL
| SMA period | SMA current | SMA prev | SMA prev2 | | 5 day SMA | 674.41 | 674.61 | 674.54 | | 12 day SMA | 673.17 | 673.44 | 672.63 | | 20 day SMA | 671.88 | 671.47 | 671.41 | | 35 day SMA | 684.8 | 685.89 | 687.3 | | 50 day SMA | 692.12 | 692.02 | 692.11 | | 100 day SMA | 690.94 | 690.72 | 690.3 | | 150 day SMA | 683.45 | 683.86 | 684.23 | | 200 day SMA | 718.37 | 720.13 | 721.69 |
|
|
