SeyaIndustries SEYAIND_BE full analysis,charts,indicators,moving averages,SMA,DMA,EMA,ADX,MACD,RSISeya Industries SEYAIND_BE WideScreen charts, DMA,SMA,EMA technical analysis, forecast prediction, by indicators ADX,MACD,RSI,CCI NSE stock exchange
Daily price and charts and targets SeyaIndustries Strong Daily Stock price targets for SeyaIndustries SEYAIND_BE are 17.56 and 19.24 | Daily Target 1 | 16.26 | | Daily Target 2 | 17.18 | | Daily Target 3 | 17.94 | | Daily Target 4 | 18.86 | | Daily Target 5 | 19.62 |
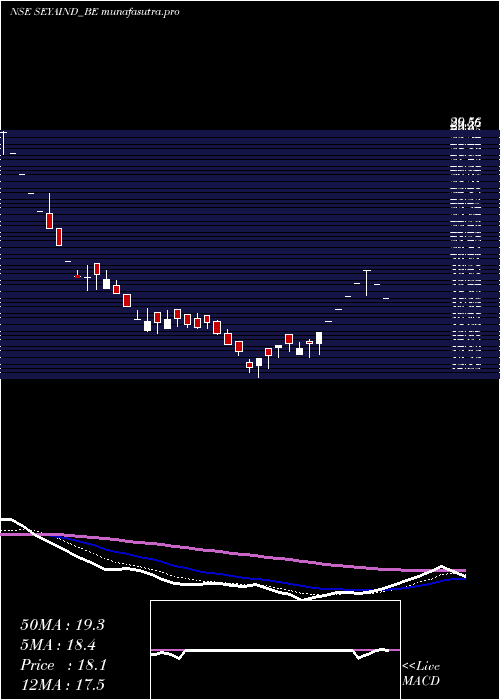
Daily price and volume Seya Industries
| Date |
Closing |
Open |
Range |
Volume |
Mon 27 October 2025 |
18.10 (1.63%) |
18.00 |
17.02 - 18.70 |
0.2892 times |
Fri 24 October 2025 |
17.81 (-2.89%) |
19.24 |
17.81 - 19.24 |
0.9111 times |
Thu 23 October 2025 |
18.34 (-0.38%) |
18.59 |
17.52 - 18.59 |
0.6748 times |
Tue 21 October 2025 |
18.41 (2.28%) |
18.02 |
18.02 - 18.80 |
0.058 times |
Mon 20 October 2025 |
18.00 (0.11%) |
17.98 |
17.08 - 18.49 |
0.6652 times |
Fri 17 October 2025 |
17.98 (2.04%) |
17.70 |
16.90 - 18.23 |
0.3684 times |
Thu 16 October 2025 |
17.62 (-3.29%) |
17.50 |
17.50 - 18.49 |
5.9591 times |
Wed 15 October 2025 |
18.22 (-0.98%) |
18.40 |
17.80 - 18.71 |
0.5035 times |
Tue 14 October 2025 |
18.40 (1.77%) |
18.08 |
17.51 - 18.88 |
0.1414 times |
Mon 13 October 2025 |
18.08 (-0.5%) |
18.26 |
17.30 - 18.87 |
0.4294 times |
Fri 10 October 2025 |
18.17 (1.51%) |
17.99 |
17.95 - 18.50 |
0.7946 times |
Weekly price and charts SeyaIndustries Strong weekly Stock price targets for SeyaIndustries SEYAIND_BE are 17.56 and 19.24 | Weekly Target 1 | 16.26 | | Weekly Target 2 | 17.18 | | Weekly Target 3 | 17.94 | | Weekly Target 4 | 18.86 | | Weekly Target 5 | 19.62 |
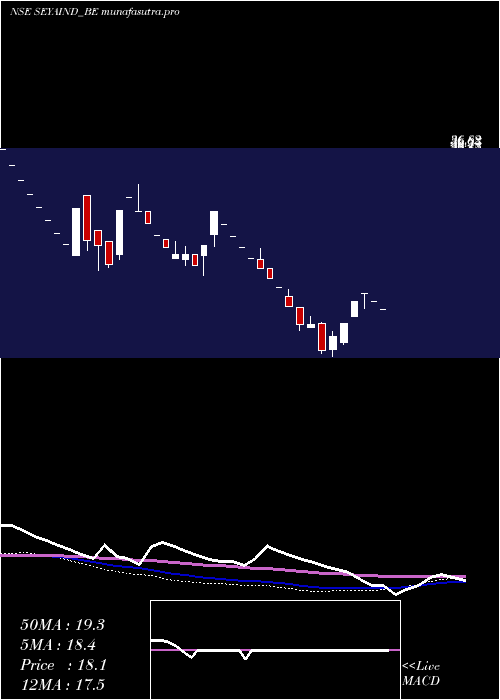
Weekly price and volumes for Seya Industries
| Date |
Closing |
Open |
Range |
Volume |
Mon 27 October 2025 |
18.10 (1.63%) |
18.00 |
17.02 - 18.70 |
0.102 times |
Fri 24 October 2025 |
17.81 (-0.95%) |
17.98 |
17.08 - 19.24 |
0.814 times |
Fri 17 October 2025 |
17.98 (-1.05%) |
18.26 |
16.90 - 18.88 |
2.6094 times |
Fri 10 October 2025 |
18.17 (8.15%) |
16.80 |
16.21 - 18.50 |
1.2497 times |
Fri 03 October 2025 |
16.80 (0.6%) |
17.49 |
16.00 - 17.58 |
0.6876 times |
Fri 26 September 2025 |
16.70 (4.31%) |
15.36 |
15.36 - 17.40 |
0.7254 times |
Fri 19 September 2025 |
16.01 (-8.04%) |
17.41 |
15.90 - 17.75 |
0.8265 times |
Fri 12 September 2025 |
17.41 (4.38%) |
16.68 |
16.45 - 18.35 |
1.35 times |
Fri 05 September 2025 |
16.68 (-10.75%) |
17.75 |
16.21 - 18.00 |
0.9358 times |
Fri 29 August 2025 |
18.69 (-1.06%) |
18.02 |
17.37 - 19.20 |
0.6995 times |
Fri 22 August 2025 |
18.89 (-0.47%) |
19.45 |
17.77 - 19.69 |
0.8263 times |
Monthly price and charts SeyaIndustries Strong monthly Stock price targets for SeyaIndustries SEYAIND_BE are 17.05 and 20.29 | Monthly Target 1 | 14.54 | | Monthly Target 2 | 16.32 | | Monthly Target 3 | 17.78 | | Monthly Target 4 | 19.56 | | Monthly Target 5 | 21.02 |
Monthly price and volumes Seya Industries
| Date |
Closing |
Open |
Range |
Volume |
Mon 27 October 2025 |
18.10 (12.63%) |
16.00 |
16.00 - 19.24 |
1.4537 times |
Tue 30 September 2025 |
16.07 (-14.02%) |
17.75 |
15.36 - 18.35 |
1.1983 times |
Fri 29 August 2025 |
18.69 (0.75%) |
18.02 |
17.37 - 19.99 |
1.0954 times |
Mon 28 July 2025 |
18.55 (-18.6%) |
21.65 |
18.55 - 21.65 |
0.1383 times |
Mon 30 June 2025 |
22.79 (44.15%) |
15.81 |
15.02 - 23.99 |
1.3028 times |
Mon 26 May 2025 |
15.81 (-16.92%) |
18.07 |
15.52 - 18.07 |
0.1074 times |
Mon 28 April 2025 |
19.03 (43.08%) |
13.50 |
12.63 - 20.04 |
1.3395 times |
Fri 28 March 2025 |
13.30 (-35.56%) |
19.63 |
13.02 - 20.50 |
2.611 times |
Mon 24 February 2025 |
20.64 (-18.48%) |
24.05 |
20.64 - 25.29 |
0.1544 times |
Mon 27 January 2025 |
25.32 (14.62%) |
23.19 |
23.00 - 29.56 |
0.5993 times |
Mon 30 December 2024 |
22.09 (-17.27%) |
26.25 |
22.09 - 26.25 |
0.2686 times |

DMA SMA EMA moving averages of Seya Industries SEYAIND_BE
DMA (daily moving average) of Seya Industries SEYAIND_BE
| DMA period | DMA value | | 5 day DMA | 18.13 | | 12 day DMA | 18.09 | | 20 day DMA | 17.52 | | 35 day DMA | 17.3 | | 50 day DMA | 17.6 | | 100 day DMA | 17.82 | | 150 day DMA | 19.64 | | 200 day DMA | 21.74 | EMA (exponential moving average) of Seya Industries SEYAIND_BE
| EMA period | EMA current | EMA prev | EMA prev2 | | 5 day EMA | 18.07 | 18.06 | 18.18 | | 12 day EMA | 17.91 | 17.88 | 17.89 | | 20 day EMA | 17.75 | 17.71 | 17.7 | | 35 day EMA | 17.76 | 17.74 | 17.74 | | 50 day EMA | 17.76 | 17.75 | 17.75 |
SMA (simple moving average) of Seya Industries SEYAIND_BE
| SMA period | SMA current | SMA prev | SMA prev2 | | 5 day SMA | 18.13 | 18.11 | 18.07 | | 12 day SMA | 18.09 | 18.05 | 17.97 | | 20 day SMA | 17.52 | 17.45 | 17.39 | | 35 day SMA | 17.3 | 17.26 | 17.23 | | 50 day SMA | 17.6 | 17.62 | 17.64 | | 100 day SMA | 17.82 | 17.8 | 17.78 | | 150 day SMA | 19.64 | 19.68 | 19.74 | | 200 day SMA | 21.74 | 21.77 | 21.8 |
|
|
