SbiEtf SETFNN50 full analysis,charts,indicators,moving averages,SMA,DMA,EMA,ADX,MACD,RSISbi Etf SETFNN50 WideScreen charts, DMA,SMA,EMA technical analysis, forecast prediction, by indicators ADX,MACD,RSI,CCI NSE stock exchange
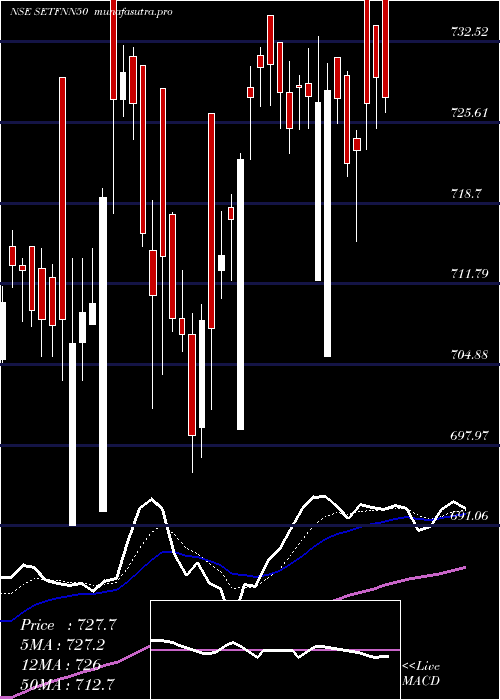
Daily price and charts and targets SbiEtf Strong Daily Stock price targets for SbiEtf SETFNN50 are 732.56 and 741.31 | Daily Target 1 | 730.71 | | Daily Target 2 | 734.4 | | Daily Target 3 | 739.45666666667 | | Daily Target 4 | 743.15 | | Daily Target 5 | 748.21 |
Daily price and volume Sbi Etf
| Date |
Closing |
Open |
Range |
Volume |
Tue 28 October 2025 |
738.10 (-0.36%) |
743.79 |
735.76 - 744.51 |
0.552 times |
Mon 27 October 2025 |
740.75 (0.27%) |
741.80 |
739.00 - 741.80 |
1.0395 times |
Fri 24 October 2025 |
738.76 (-0.07%) |
740.79 |
735.46 - 740.80 |
0.6148 times |
Thu 23 October 2025 |
739.28 (-0.27%) |
749.10 |
737.23 - 749.10 |
1.3972 times |
Tue 21 October 2025 |
741.28 (0.19%) |
743.61 |
737.14 - 746.90 |
0.3777 times |
Mon 20 October 2025 |
739.91 (0.42%) |
740.00 |
736.95 - 743.98 |
0.846 times |
Fri 17 October 2025 |
736.84 (0.13%) |
739.59 |
735.85 - 741.69 |
0.7169 times |
Thu 16 October 2025 |
735.92 (0.26%) |
725.00 |
725.00 - 741.18 |
1.1463 times |
Wed 15 October 2025 |
733.98 (0.93%) |
727.26 |
726.30 - 736.12 |
1.7468 times |
Tue 14 October 2025 |
727.25 (-0.46%) |
733.50 |
724.00 - 734.60 |
1.5628 times |
Mon 13 October 2025 |
730.62 (0.03%) |
732.09 |
725.00 - 732.09 |
0.6269 times |
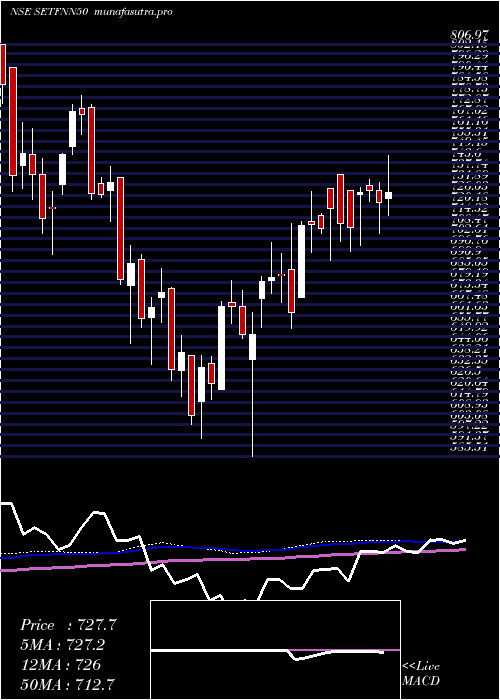
Weekly price and charts SbiEtf Strong weekly Stock price targets for SbiEtf SETFNN50 are 732.56 and 741.31 | Weekly Target 1 | 730.71 | | Weekly Target 2 | 734.4 | | Weekly Target 3 | 739.45666666667 | | Weekly Target 4 | 743.15 | | Weekly Target 5 | 748.21 |
Weekly price and volumes for Sbi Etf
| Date |
Closing |
Open |
Range |
Volume |
Tue 28 October 2025 |
738.10 (-0.09%) |
741.80 |
735.76 - 744.51 |
0.3133 times |
Fri 24 October 2025 |
738.76 (0.26%) |
740.00 |
735.46 - 749.10 |
0.637 times |
Fri 17 October 2025 |
736.84 (0.88%) |
732.09 |
724.00 - 741.69 |
1.1417 times |
Fri 10 October 2025 |
730.38 (0.29%) |
729.44 |
723.47 - 736.98 |
0.7511 times |
Fri 03 October 2025 |
728.27 (1.7%) |
701.02 |
694.63 - 729.80 |
1.0128 times |
Fri 26 September 2025 |
716.11 (-3.36%) |
742.00 |
714.24 - 765.87 |
1.4488 times |
Fri 19 September 2025 |
741.00 (2.17%) |
727.39 |
723.16 - 742.89 |
1.0607 times |
Fri 12 September 2025 |
725.29 (1.44%) |
717.49 |
714.24 - 726.79 |
0.974 times |
Fri 05 September 2025 |
714.99 (2.05%) |
703.79 |
700.65 - 734.76 |
1.1643 times |
Fri 29 August 2025 |
700.60 (-2.65%) |
723.00 |
698.00 - 724.30 |
1.4963 times |
Fri 22 August 2025 |
719.68 (1.65%) |
710.01 |
710.00 - 730.00 |
1.1433 times |
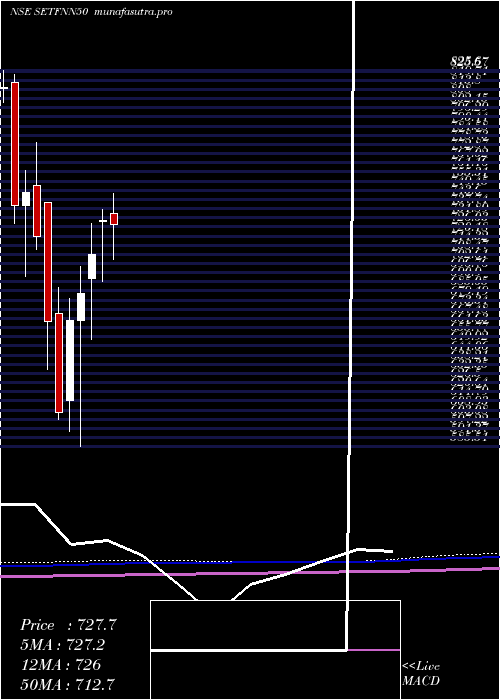
Monthly price and charts SbiEtf Strong monthly Stock price targets for SbiEtf SETFNN50 are 729.55 and 757.65 | Monthly Target 1 | 707.97 | | Monthly Target 2 | 723.03 | | Monthly Target 3 | 736.06666666667 | | Monthly Target 4 | 751.13 | | Monthly Target 5 | 764.17 |
Monthly price and volumes Sbi Etf
| Date |
Closing |
Open |
Range |
Volume |
Tue 28 October 2025 |
738.10 (2.12%) |
724.80 |
721.00 - 749.10 |
0.5559 times |
Tue 30 September 2025 |
722.75 (3.16%) |
703.79 |
694.63 - 765.87 |
0.9299 times |
Fri 29 August 2025 |
700.60 (-1.81%) |
731.38 |
692.42 - 731.38 |
0.8067 times |
Thu 31 July 2025 |
713.55 (-2.29%) |
734.79 |
702.02 - 747.60 |
0.6847 times |
Mon 30 June 2025 |
730.25 (3.11%) |
729.49 |
691.06 - 737.19 |
0.8704 times |
Fri 30 May 2025 |
708.24 (3.65%) |
692.83 |
654.25 - 728.29 |
1.0864 times |
Wed 30 April 2025 |
683.27 (2.54%) |
666.37 |
585.51 - 700.84 |
1.0824 times |
Fri 28 March 2025 |
666.36 (9.68%) |
615.00 |
595.02 - 680.00 |
1.363 times |
Fri 28 February 2025 |
607.56 (-8.72%) |
670.99 |
603.00 - 686.98 |
1.1178 times |
Fri 31 January 2025 |
665.58 (-7.53%) |
741.40 |
635.10 - 741.40 |
1.5028 times |
Tue 31 December 2024 |
719.80 (-3.79%) |
752.29 |
711.82 - 779.95 |
0.7685 times |
DMA SMA EMA moving averages of Sbi Etf SETFNN50
DMA (daily moving average) of Sbi Etf SETFNN50
| DMA period | DMA value | | 5 day DMA | 739.63 | | 12 day DMA | 736.09 | | 20 day DMA | 732.32 | | 35 day DMA | 731.09 | | 50 day DMA | 726.18 | | 100 day DMA | 721.98 | | 150 day DMA | 709.15 | | 200 day DMA | 694.88 | EMA (exponential moving average) of Sbi Etf SETFNN50
| EMA period | EMA current | EMA prev | EMA prev2 | | 5 day EMA | 738.81 | 739.17 | 738.38 | | 12 day EMA | 736.5 | 736.21 | 735.38 | | 20 day EMA | 734.11 | 733.69 | 732.95 | | 35 day EMA | 729.44 | 728.93 | 728.23 | | 50 day EMA | 725.67 | 725.16 | 724.52 |
SMA (simple moving average) of Sbi Etf SETFNN50
| SMA period | SMA current | SMA prev | SMA prev2 | | 5 day SMA | 739.63 | 740 | 739.21 | | 12 day SMA | 736.09 | 735.21 | 734.01 | | 20 day SMA | 732.32 | 731.22 | 730.51 | | 35 day SMA | 731.09 | 730.43 | 729.69 | | 50 day SMA | 726.18 | 725.56 | 724.82 | | 100 day SMA | 721.98 | 721.69 | 721.35 | | 150 day SMA | 709.15 | 708.6 | 707.96 | | 200 day SMA | 694.88 | 694.74 | 694.7 |
|
|
