SbiEtf SETFNIFBK full analysis,charts,indicators,moving averages,SMA,DMA,EMA,ADX,MACD,RSISbi Etf SETFNIFBK WideScreen charts, DMA,SMA,EMA technical analysis, forecast prediction, by indicators ADX,MACD,RSI,CCI NSE stock exchange
Daily price and charts and targets SbiEtf Strong Daily Stock price targets for SbiEtf SETFNIFBK are 596.17 and 600.26 | Daily Target 1 | 592.99 | | Daily Target 2 | 595.26 | | Daily Target 3 | 597.07666666667 | | Daily Target 4 | 599.35 | | Daily Target 5 | 601.17 |
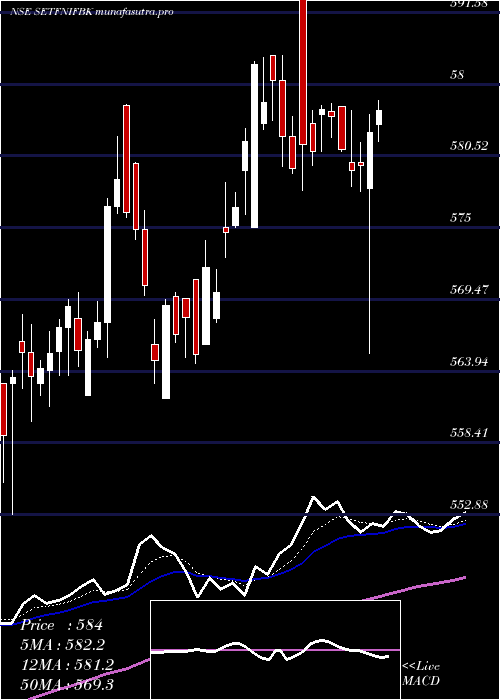
Daily price and volume Sbi Etf
| Date |
Closing |
Open |
Range |
Volume |
Wed 29 October 2025 |
597.54 (0.34%) |
595.41 |
594.80 - 598.89 |
0.9563 times |
Tue 28 October 2025 |
595.54 (0.19%) |
595.36 |
591.51 - 596.69 |
0.1628 times |
Mon 27 October 2025 |
594.40 (0.7%) |
590.45 |
590.25 - 596.00 |
0.3822 times |
Fri 24 October 2025 |
590.27 (-0.71%) |
594.52 |
588.04 - 595.00 |
0.439 times |
Thu 23 October 2025 |
594.52 (0.18%) |
596.10 |
592.50 - 599.84 |
0.6429 times |
Tue 21 October 2025 |
593.44 (-0.11%) |
594.11 |
592.34 - 597.37 |
0.0762 times |
Mon 20 October 2025 |
594.11 (0.64%) |
590.50 |
590.50 - 595.92 |
0.331 times |
Fri 17 October 2025 |
590.33 (0.55%) |
584.29 |
584.29 - 591.80 |
2.6707 times |
Thu 16 October 2025 |
587.11 (3.56%) |
580.01 |
579.84 - 588.38 |
1.4894 times |
Wed 15 October 2025 |
566.92 (-2.03%) |
578.01 |
465.64 - 582.84 |
2.8495 times |
Tue 14 October 2025 |
578.64 (-0.26%) |
580.16 |
576.58 - 581.53 |
0.3291 times |
Weekly price and charts SbiEtf Strong weekly Stock price targets for SbiEtf SETFNIFBK are 593.9 and 602.54 | Weekly Target 1 | 586.92 | | Weekly Target 2 | 592.23 | | Weekly Target 3 | 595.56 | | Weekly Target 4 | 600.87 | | Weekly Target 5 | 604.2 |
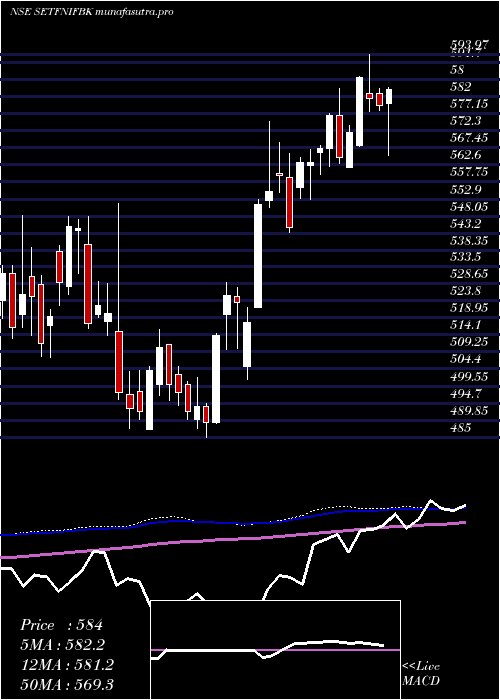
Weekly price and volumes for Sbi Etf
| Date |
Closing |
Open |
Range |
Volume |
Wed 29 October 2025 |
597.54 (1.23%) |
590.45 |
590.25 - 598.89 |
0.2723 times |
Fri 24 October 2025 |
590.27 (-0.01%) |
590.50 |
588.04 - 599.84 |
0.2701 times |
Fri 17 October 2025 |
590.33 (1.78%) |
579.99 |
465.64 - 591.80 |
1.6806 times |
Fri 10 October 2025 |
580.02 (2%) |
568.65 |
565.06 - 581.00 |
1.2467 times |
Fri 03 October 2025 |
568.65 (2%) |
561.99 |
555.61 - 569.46 |
1.8909 times |
Fri 26 September 2025 |
557.51 (-2.03%) |
569.00 |
556.41 - 571.89 |
3.413 times |
Fri 19 September 2025 |
569.05 (1.21%) |
564.99 |
561.00 - 573.59 |
0.2116 times |
Fri 12 September 2025 |
562.24 (1.34%) |
555.99 |
554.28 - 563.25 |
0.3909 times |
Fri 05 September 2025 |
554.83 (0.8%) |
564.19 |
548.52 - 564.19 |
0.2126 times |
Fri 29 August 2025 |
550.43 (-2.64%) |
568.19 |
549.55 - 570.11 |
0.4112 times |
Fri 22 August 2025 |
565.37 (-0.29%) |
573.09 |
564.75 - 575.00 |
0.3026 times |
Monthly price and charts SbiEtf Strong monthly Stock price targets for SbiEtf SETFNIFBK are 531.59 and 665.79 | Monthly Target 1 | 420.14 | | Monthly Target 2 | 508.84 | | Monthly Target 3 | 554.34 | | Monthly Target 4 | 643.04 | | Monthly Target 5 | 688.54 |
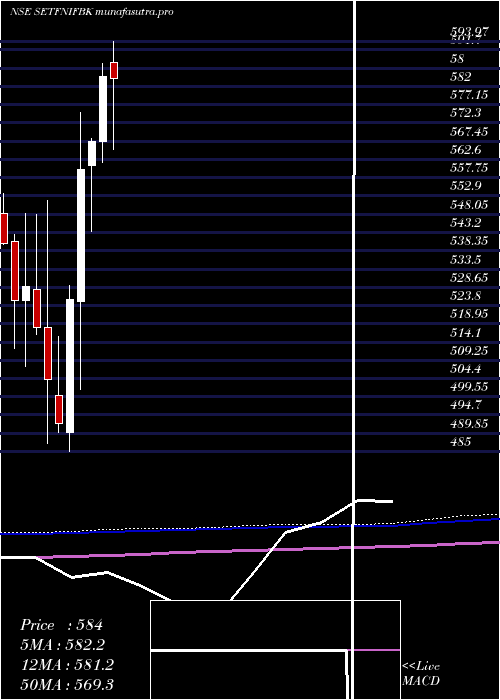
Monthly price and volumes Sbi Etf
| Date |
Closing |
Open |
Range |
Volume |
Wed 29 October 2025 |
597.54 (6.92%) |
559.45 |
465.64 - 599.84 |
0.7291 times |
Tue 30 September 2025 |
558.88 (1.54%) |
564.19 |
548.52 - 573.59 |
0.6612 times |
Fri 29 August 2025 |
550.43 (-3.81%) |
575.12 |
549.55 - 575.12 |
0.1592 times |
Thu 31 July 2025 |
572.26 (-2.13%) |
588.23 |
565.30 - 596.30 |
0.5616 times |
Mon 30 June 2025 |
584.69 (3.06%) |
567.31 |
561.79 - 588.10 |
0.9784 times |
Fri 30 May 2025 |
567.32 (1.32%) |
560.91 |
543.38 - 568.29 |
1.1889 times |
Wed 30 April 2025 |
559.95 (6.56%) |
524.99 |
501.43 - 574.97 |
2.0718 times |
Fri 28 March 2025 |
525.46 (6.72%) |
490.00 |
485.00 - 529.01 |
1.1935 times |
Fri 28 February 2025 |
492.39 (-2.32%) |
499.99 |
490.10 - 515.64 |
0.4324 times |
Fri 31 January 2025 |
504.10 (-2.67%) |
518.00 |
487.01 - 551.60 |
2.0239 times |
Tue 31 December 2024 |
517.93 (-2.08%) |
528.01 |
516.00 - 547.96 |
0.718 times |
DMA SMA EMA moving averages of Sbi Etf SETFNIFBK
DMA (daily moving average) of Sbi Etf SETFNIFBK
| DMA period | DMA value | | 5 day DMA | 594.45 | | 12 day DMA | 588.58 | | 20 day DMA | 581.86 | | 35 day DMA | 573.97 | | 50 day DMA | 569.77 | | 100 day DMA | 572.54 | | 150 day DMA | 564.43 | | 200 day DMA | 547.98 | EMA (exponential moving average) of Sbi Etf SETFNIFBK
| EMA period | EMA current | EMA prev | EMA prev2 | | 5 day EMA | 594.55 | 593.05 | 591.8 | | 12 day EMA | 589.16 | 587.64 | 586.21 | | 20 day EMA | 584.06 | 582.64 | 581.28 | | 35 day EMA | 577.87 | 576.71 | 575.6 | | 50 day EMA | 571.88 | 570.83 | 569.82 |
SMA (simple moving average) of Sbi Etf SETFNIFBK
| SMA period | SMA current | SMA prev | SMA prev2 | | 5 day SMA | 594.45 | 593.63 | 593.35 | | 12 day SMA | 588.58 | 587.12 | 585.47 | | 20 day SMA | 581.86 | 579.83 | 577.93 | | 35 day SMA | 573.97 | 572.78 | 571.61 | | 50 day SMA | 569.77 | 569.16 | 568.56 | | 100 day SMA | 572.54 | 572.24 | 571.95 | | 150 day SMA | 564.43 | 563.84 | 563.25 | | 200 day SMA | 547.98 | 547.55 | 547.11 |
|
|
