SbiEtf SETF10GILT full analysis,charts,indicators,moving averages,SMA,DMA,EMA,ADX,MACD,RSISbi Etf SETF10GILT WideScreen charts, DMA,SMA,EMA technical analysis, forecast prediction, by indicators ADX,MACD,RSI,CCI NSE stock exchange
Daily price and charts and targets SbiEtf Strong Daily Stock price targets for SbiEtf SETF10GILT are 257.66 and 259.4 | Daily Target 1 | 257.27 | | Daily Target 2 | 258.04 | | Daily Target 3 | 259.01333333333 | | Daily Target 4 | 259.78 | | Daily Target 5 | 260.75 |
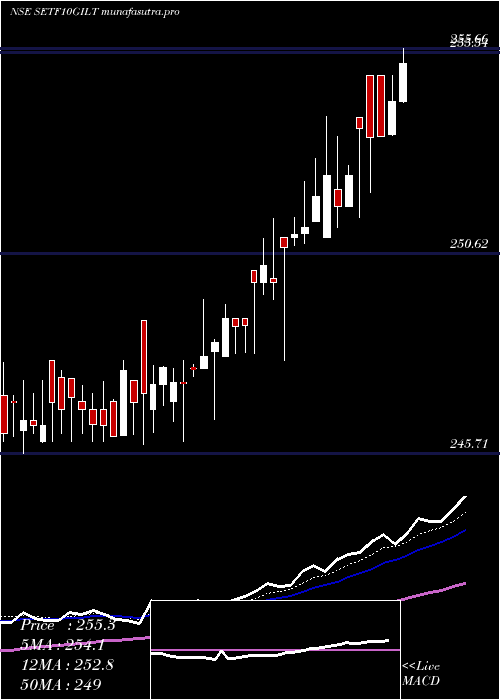
Daily price and volume Sbi Etf
| Date |
Closing |
Open |
Range |
Volume |
Tue 28 October 2025 |
258.80 (-0.09%) |
259.99 |
258.25 - 259.99 |
0.8752 times |
Mon 27 October 2025 |
259.03 (-0.08%) |
260.49 |
258.95 - 260.49 |
2.8034 times |
Fri 24 October 2025 |
259.24 (-0.07%) |
259.71 |
258.51 - 260.00 |
0.7515 times |
Thu 23 October 2025 |
259.42 (-0.27%) |
260.50 |
258.10 - 260.50 |
1.0858 times |
Tue 21 October 2025 |
260.12 (0.53%) |
260.04 |
258.12 - 261.50 |
0.4 times |
Mon 20 October 2025 |
258.75 (0.22%) |
259.46 |
258.17 - 260.22 |
0.5473 times |
Fri 17 October 2025 |
258.17 (-0.22%) |
258.70 |
258.16 - 260.44 |
0.9911 times |
Thu 16 October 2025 |
258.73 (-0.12%) |
259.04 |
258.70 - 259.53 |
0.5888 times |
Wed 15 October 2025 |
259.04 (0.19%) |
259.49 |
258.50 - 259.49 |
1.344 times |
Tue 14 October 2025 |
258.56 (-0.16%) |
259.25 |
257.18 - 259.25 |
0.6129 times |
Mon 13 October 2025 |
258.98 (-0.03%) |
260.00 |
257.12 - 260.00 |
0.2652 times |
Weekly price and charts SbiEtf Strong weekly Stock price targets for SbiEtf SETF10GILT are 257.41 and 259.65 | Weekly Target 1 | 256.94 | | Weekly Target 2 | 257.87 | | Weekly Target 3 | 259.18 | | Weekly Target 4 | 260.11 | | Weekly Target 5 | 261.42 |
Weekly price and volumes for Sbi Etf
| Date |
Closing |
Open |
Range |
Volume |
Tue 28 October 2025 |
258.80 (-0.17%) |
260.49 |
258.25 - 260.49 |
0.5754 times |
Fri 24 October 2025 |
259.24 (0.41%) |
259.46 |
258.10 - 261.50 |
0.4356 times |
Fri 17 October 2025 |
258.17 (-0.35%) |
260.00 |
257.12 - 260.44 |
0.5947 times |
Fri 10 October 2025 |
259.07 (0.41%) |
258.99 |
257.12 - 259.84 |
1.2956 times |
Fri 03 October 2025 |
258.00 (-0.29%) |
261.90 |
255.63 - 261.90 |
1.3227 times |
Fri 26 September 2025 |
258.76 (0.3%) |
254.56 |
254.56 - 259.23 |
1.3811 times |
Fri 19 September 2025 |
257.98 (-0.02%) |
259.33 |
256.84 - 260.00 |
1.4033 times |
Fri 12 September 2025 |
258.04 (-0.06%) |
259.48 |
257.00 - 259.48 |
1.3529 times |
Fri 05 September 2025 |
258.19 (0.86%) |
257.49 |
250.37 - 258.89 |
0.9583 times |
Fri 29 August 2025 |
255.98 (-0.31%) |
255.86 |
253.50 - 257.50 |
0.6803 times |
Fri 22 August 2025 |
256.77 (0.04%) |
260.45 |
255.17 - 260.45 |
0.6346 times |

Monthly price and charts SbiEtf Strong monthly Stock price targets for SbiEtf SETF10GILT are 257.65 and 262.65 | Monthly Target 1 | 253.93 | | Monthly Target 2 | 256.37 | | Monthly Target 3 | 258.93333333333 | | Monthly Target 4 | 261.37 | | Monthly Target 5 | 263.93 |
Monthly price and volumes Sbi Etf
| Date |
Closing |
Open |
Range |
Volume |
Tue 28 October 2025 |
258.80 (0.54%) |
257.40 |
256.50 - 261.50 |
0.752 times |
Tue 30 September 2025 |
257.40 (0.55%) |
257.49 |
250.37 - 261.90 |
1.281 times |
Fri 29 August 2025 |
255.98 (-0.74%) |
259.17 |
253.50 - 260.45 |
0.6125 times |
Thu 31 July 2025 |
257.89 (0.1%) |
256.25 |
256.25 - 265.17 |
0.7259 times |
Mon 30 June 2025 |
257.63 (-0.85%) |
259.74 |
251.92 - 265.21 |
1.5952 times |
Fri 30 May 2025 |
259.84 (1.67%) |
256.49 |
251.61 - 260.49 |
0.8729 times |
Wed 30 April 2025 |
255.57 (2.27%) |
251.01 |
248.01 - 256.99 |
2.1914 times |
Fri 28 March 2025 |
249.90 (1.25%) |
246.81 |
245.94 - 251.49 |
0.522 times |
Fri 28 February 2025 |
246.81 (0.3%) |
245.03 |
245.03 - 254.31 |
0.4111 times |
Fri 31 January 2025 |
246.07 (1.39%) |
242.49 |
241.01 - 247.18 |
1.036 times |
Tue 31 December 2024 |
242.70 (0.6%) |
243.99 |
241.15 - 244.72 |
0.6271 times |

DMA SMA EMA moving averages of Sbi Etf SETF10GILT
DMA (daily moving average) of Sbi Etf SETF10GILT
| DMA period | DMA value | | 5 day DMA | 259.32 | | 12 day DMA | 258.99 | | 20 day DMA | 258.58 | | 35 day DMA | 258.46 | | 50 day DMA | 257.78 | | 100 day DMA | 257.98 | | 150 day DMA | 256.97 | | 200 day DMA | 254.17 | EMA (exponential moving average) of Sbi Etf SETF10GILT
| EMA period | EMA current | EMA prev | EMA prev2 | | 5 day EMA | 259.04 | 259.16 | 259.23 | | 12 day EMA | 258.93 | 258.95 | 258.93 | | 20 day EMA | 258.73 | 258.72 | 258.69 | | 35 day EMA | 258.29 | 258.26 | 258.21 | | 50 day EMA | 257.91 | 257.87 | 257.82 |
SMA (simple moving average) of Sbi Etf SETF10GILT
| SMA period | SMA current | SMA prev | SMA prev2 | | 5 day SMA | 259.32 | 259.31 | 259.14 | | 12 day SMA | 258.99 | 258.96 | 258.93 | | 20 day SMA | 258.58 | 258.58 | 258.55 | | 35 day SMA | 258.46 | 258.44 | 258.38 | | 50 day SMA | 257.78 | 257.74 | 257.69 | | 100 day SMA | 257.98 | 257.98 | 257.98 | | 150 day SMA | 256.97 | 256.9 | 256.82 | | 200 day SMA | 254.17 | 254.09 | 254.01 |
|
|
