SequentScientific SEQUENT full analysis,charts,indicators,moving averages,SMA,DMA,EMA,ADX,MACD,RSISequent Scientific SEQUENT WideScreen charts, DMA,SMA,EMA technical analysis, forecast prediction, by indicators ADX,MACD,RSI,CCI NSE stock exchange
operates under Pharmaceuticals sector
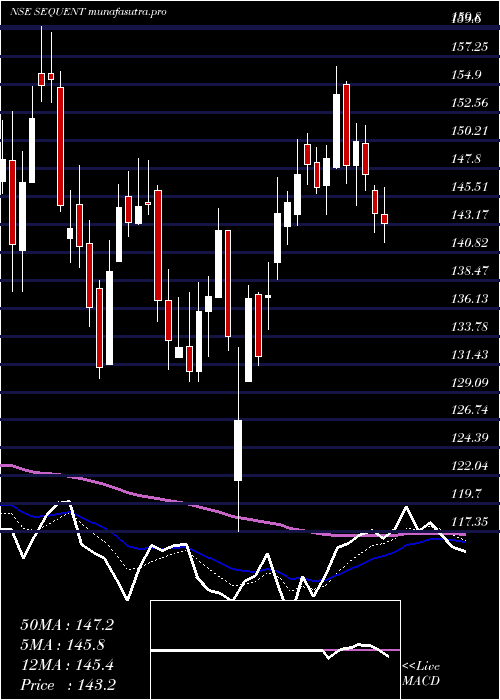
Daily price and charts and targets SequentScientific Strong Daily Stock price targets for SequentScientific SEQUENT are 204.14 and 211.63 | Daily Target 1 | 198.47 | | Daily Target 2 | 202.32 | | Daily Target 3 | 205.96 | | Daily Target 4 | 209.81 | | Daily Target 5 | 213.45 |
Daily price and volume Sequent Scientific
| Date |
Closing |
Open |
Range |
Volume |
Tue 28 October 2025 |
206.17 (1.24%) |
204.70 |
202.11 - 209.60 |
1.3756 times |
Mon 27 October 2025 |
203.64 (0.78%) |
202.94 |
200.51 - 205.53 |
0.798 times |
Fri 24 October 2025 |
202.06 (-0.77%) |
204.55 |
200.23 - 204.84 |
0.6274 times |
Thu 23 October 2025 |
203.62 (-1%) |
205.69 |
199.21 - 205.90 |
0.8844 times |
Tue 21 October 2025 |
205.68 (3.53%) |
198.67 |
198.50 - 206.90 |
0.3726 times |
Mon 20 October 2025 |
198.67 (-1.82%) |
203.00 |
195.70 - 203.55 |
1.0244 times |
Fri 17 October 2025 |
202.36 (-5.94%) |
215.80 |
201.20 - 215.80 |
1.4527 times |
Thu 16 October 2025 |
215.14 (0.85%) |
214.90 |
212.50 - 217.99 |
1.0746 times |
Wed 15 October 2025 |
213.32 (2.08%) |
209.04 |
207.50 - 214.66 |
0.9248 times |
Tue 14 October 2025 |
208.98 (-3.44%) |
220.00 |
206.50 - 220.00 |
1.4653 times |
Mon 13 October 2025 |
216.43 (0.18%) |
216.04 |
213.74 - 219.29 |
1.3257 times |
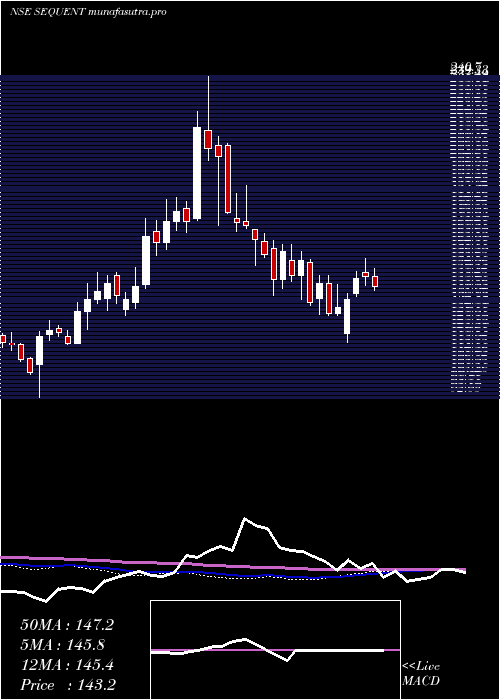
Weekly price and charts SequentScientific Strong weekly Stock price targets for SequentScientific SEQUENT are 203.34 and 212.43 | Weekly Target 1 | 196.34 | | Weekly Target 2 | 201.25 | | Weekly Target 3 | 205.42666666667 | | Weekly Target 4 | 210.34 | | Weekly Target 5 | 214.52 |
Weekly price and volumes for Sequent Scientific
| Date |
Closing |
Open |
Range |
Volume |
Tue 28 October 2025 |
206.17 (2.03%) |
202.94 |
200.51 - 209.60 |
0.4 times |
Fri 24 October 2025 |
202.06 (-0.15%) |
203.00 |
195.70 - 206.90 |
0.5353 times |
Fri 17 October 2025 |
202.36 (-6.33%) |
216.04 |
201.20 - 220.00 |
1.149 times |
Fri 10 October 2025 |
216.04 (7.04%) |
204.80 |
199.93 - 220.45 |
2.5452 times |
Fri 03 October 2025 |
201.84 (6.5%) |
190.43 |
183.31 - 203.38 |
0.6326 times |
Fri 26 September 2025 |
189.53 (-5.54%) |
202.40 |
187.52 - 209.00 |
1.3272 times |
Fri 19 September 2025 |
200.64 (9.93%) |
183.00 |
179.92 - 203.90 |
2.1263 times |
Fri 12 September 2025 |
182.51 (-0.71%) |
185.60 |
182.16 - 189.90 |
0.5321 times |
Fri 05 September 2025 |
183.81 (8.53%) |
168.55 |
168.55 - 185.16 |
0.5344 times |
Fri 29 August 2025 |
169.37 (-3.68%) |
175.80 |
167.95 - 176.52 |
0.2179 times |
Fri 22 August 2025 |
175.85 (0.05%) |
176.09 |
173.60 - 180.38 |
0.3612 times |
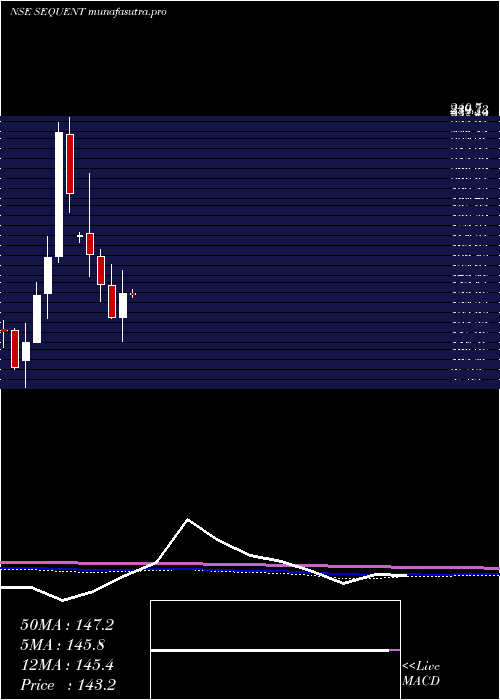
Monthly price and charts SequentScientific Strong monthly Stock price targets for SequentScientific SEQUENT are 196.12 and 230.51 | Monthly Target 1 | 169.84 | | Monthly Target 2 | 188 | | Monthly Target 3 | 204.22666666667 | | Monthly Target 4 | 222.39 | | Monthly Target 5 | 238.62 |
Monthly price and volumes Sequent Scientific
| Date |
Closing |
Open |
Range |
Volume |
Tue 28 October 2025 |
206.17 (10.67%) |
186.29 |
186.06 - 220.45 |
1.4147 times |
Tue 30 September 2025 |
186.29 (9.99%) |
168.55 |
168.55 - 209.00 |
1.3453 times |
Fri 29 August 2025 |
169.37 (-1.51%) |
171.00 |
166.00 - 184.70 |
0.6497 times |
Thu 31 July 2025 |
171.97 (-10.78%) |
192.75 |
171.00 - 197.00 |
0.6577 times |
Mon 30 June 2025 |
192.75 (0.47%) |
189.90 |
182.25 - 203.45 |
1.0116 times |
Fri 30 May 2025 |
191.84 (33.13%) |
144.00 |
141.63 - 198.00 |
1.8886 times |
Wed 30 April 2025 |
144.10 (10.15%) |
130.82 |
117.35 - 156.40 |
0.7958 times |
Fri 28 March 2025 |
130.82 (-11.97%) |
148.50 |
129.99 - 159.80 |
0.8425 times |
Fri 28 February 2025 |
148.61 (-10%) |
164.15 |
139.31 - 167.99 |
0.5407 times |
Fri 31 January 2025 |
165.13 (-6.1%) |
177.00 |
153.19 - 210.00 |
0.8533 times |
Tue 31 December 2024 |
175.86 (-11.49%) |
175.20 |
171.75 - 177.70 |
0.0201 times |
DMA SMA EMA moving averages of Sequent Scientific SEQUENT
DMA (daily moving average) of Sequent Scientific SEQUENT
| DMA period | DMA value | | 5 day DMA | 204.23 | | 12 day DMA | 207.68 | | 20 day DMA | 204.7 | | 35 day DMA | 198.96 | | 50 day DMA | 191.76 | | 100 day DMA | 188.25 | | 150 day DMA | 178.05 | | 200 day DMA | 173.57 | EMA (exponential moving average) of Sequent Scientific SEQUENT
| EMA period | EMA current | EMA prev | EMA prev2 | | 5 day EMA | 204.68 | 203.93 | 204.07 | | 12 day EMA | 205.06 | 204.86 | 205.08 | | 20 day EMA | 203.4 | 203.11 | 203.05 | | 35 day EMA | 197.9 | 197.41 | 197.04 | | 50 day EMA | 191.48 | 190.88 | 190.36 |
SMA (simple moving average) of Sequent Scientific SEQUENT
| SMA period | SMA current | SMA prev | SMA prev2 | | 5 day SMA | 204.23 | 202.73 | 202.48 | | 12 day SMA | 207.68 | 208.35 | 209.34 | | 20 day SMA | 204.7 | 203.87 | 203.4 | | 35 day SMA | 198.96 | 198.32 | 197.56 | | 50 day SMA | 191.76 | 191.06 | 190.48 | | 100 day SMA | 188.25 | 188.11 | 188 | | 150 day SMA | 178.05 | 177.64 | 177.21 | | 200 day SMA | 173.57 | 173.51 | 173.51 |
|
|
