Sepc SEPC full analysis,charts,indicators,moving averages,SMA,DMA,EMA,ADX,MACD,RSISepc SEPC WideScreen charts, DMA,SMA,EMA technical analysis, forecast prediction, by indicators ADX,MACD,RSI,CCI NSE stock exchange
Daily price and charts and targets Sepc Strong Daily Stock price targets for Sepc SEPC are 11.09 and 11.33 | Daily Target 1 | 11.04 | | Daily Target 2 | 11.13 | | Daily Target 3 | 11.283333333333 | | Daily Target 4 | 11.37 | | Daily Target 5 | 11.52 |
Daily price and volume Sepc
| Date |
Closing |
Open |
Range |
Volume |
Tue 28 October 2025 |
11.21 (-1.58%) |
11.39 |
11.20 - 11.44 |
1.1903 times |
Mon 27 October 2025 |
11.39 (-0.18%) |
11.53 |
11.32 - 11.60 |
0.7962 times |
Fri 24 October 2025 |
11.41 (-0.44%) |
11.46 |
11.35 - 11.60 |
0.8461 times |
Thu 23 October 2025 |
11.46 (0.79%) |
11.43 |
11.38 - 11.61 |
1.5179 times |
Tue 21 October 2025 |
11.37 (0%) |
11.47 |
11.33 - 11.54 |
0.4015 times |
Mon 20 October 2025 |
11.37 (-0.18%) |
11.60 |
11.30 - 11.60 |
0.8792 times |
Fri 17 October 2025 |
11.39 (-0.61%) |
11.46 |
11.34 - 11.55 |
0.9826 times |
Thu 16 October 2025 |
11.46 (1.24%) |
11.39 |
11.35 - 11.79 |
1.0982 times |
Wed 15 October 2025 |
11.32 (-0.61%) |
11.44 |
11.28 - 11.50 |
1.2686 times |
Tue 14 October 2025 |
11.39 (-2.15%) |
11.60 |
11.36 - 11.71 |
1.0195 times |
Mon 13 October 2025 |
11.64 (-1.44%) |
11.62 |
11.60 - 11.75 |
0.8386 times |
Weekly price and charts Sepc Strong weekly Stock price targets for Sepc SEPC are 11.01 and 11.41 | Weekly Target 1 | 10.94 | | Weekly Target 2 | 11.07 | | Weekly Target 3 | 11.336666666667 | | Weekly Target 4 | 11.47 | | Weekly Target 5 | 11.74 |
Weekly price and volumes for Sepc
| Date |
Closing |
Open |
Range |
Volume |
Tue 28 October 2025 |
11.21 (-1.75%) |
11.53 |
11.20 - 11.60 |
0.2253 times |
Fri 24 October 2025 |
11.41 (0.18%) |
11.60 |
11.30 - 11.61 |
0.4134 times |
Fri 17 October 2025 |
11.39 (-3.56%) |
11.62 |
11.28 - 11.79 |
0.5907 times |
Fri 10 October 2025 |
11.81 (-2.88%) |
12.18 |
11.60 - 12.19 |
0.6306 times |
Fri 03 October 2025 |
12.16 (1.08%) |
12.06 |
11.76 - 12.24 |
0.6494 times |
Fri 26 September 2025 |
12.03 (-7.89%) |
13.14 |
11.96 - 13.73 |
2.0701 times |
Fri 19 September 2025 |
13.06 (10.3%) |
11.90 |
11.90 - 13.48 |
3.8463 times |
Fri 12 September 2025 |
11.84 (1.02%) |
11.87 |
11.73 - 12.31 |
0.5916 times |
Fri 05 September 2025 |
11.72 (4.27%) |
11.27 |
11.22 - 12.33 |
0.6425 times |
Fri 29 August 2025 |
11.24 (-5.31%) |
11.87 |
11.20 - 12.00 |
0.3401 times |
Fri 22 August 2025 |
11.87 (6.17%) |
11.91 |
11.52 - 12.34 |
1.066 times |
Monthly price and charts Sepc Strong monthly Stock price targets for Sepc SEPC are 10.69 and 11.73 | Monthly Target 1 | 10.51 | | Monthly Target 2 | 10.86 | | Monthly Target 3 | 11.55 | | Monthly Target 4 | 11.9 | | Monthly Target 5 | 12.59 |
Monthly price and volumes Sepc
| Date |
Closing |
Open |
Range |
Volume |
Tue 28 October 2025 |
11.21 (-6.27%) |
12.00 |
11.20 - 12.24 |
0.3314 times |
Tue 30 September 2025 |
11.96 (6.41%) |
11.27 |
11.22 - 13.73 |
1.1489 times |
Fri 29 August 2025 |
11.24 (-4.1%) |
11.75 |
10.90 - 12.34 |
0.3975 times |
Thu 31 July 2025 |
11.72 (-11.41%) |
13.23 |
11.53 - 14.40 |
1.1771 times |
Mon 30 June 2025 |
13.23 (-11.62%) |
14.95 |
12.78 - 15.36 |
2.2208 times |
Fri 30 May 2025 |
14.97 (6.62%) |
14.04 |
12.95 - 16.17 |
1.1258 times |
Wed 30 April 2025 |
14.04 (-0.14%) |
14.04 |
11.87 - 16.23 |
0.5946 times |
Fri 28 March 2025 |
14.06 (5.63%) |
13.44 |
12.02 - 17.49 |
1.6832 times |
Fri 28 February 2025 |
13.31 (-25.22%) |
17.69 |
13.10 - 17.80 |
0.4743 times |
Fri 31 January 2025 |
17.80 (-16.2%) |
21.34 |
15.71 - 22.74 |
0.8465 times |
Tue 31 December 2024 |
21.24 (-13.9%) |
24.59 |
20.74 - 25.84 |
0.8053 times |
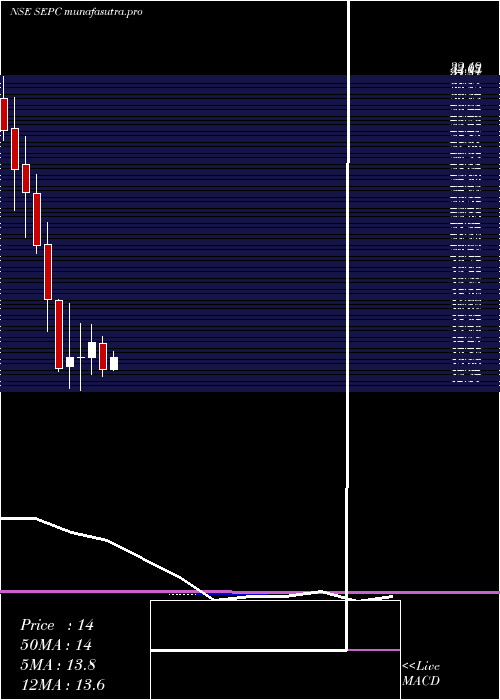
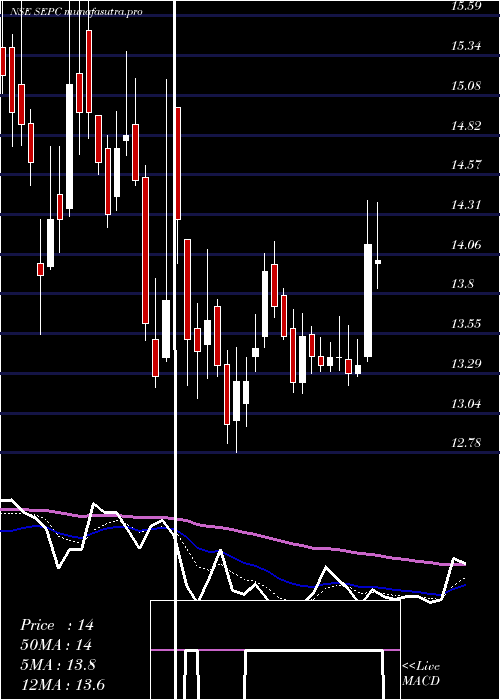
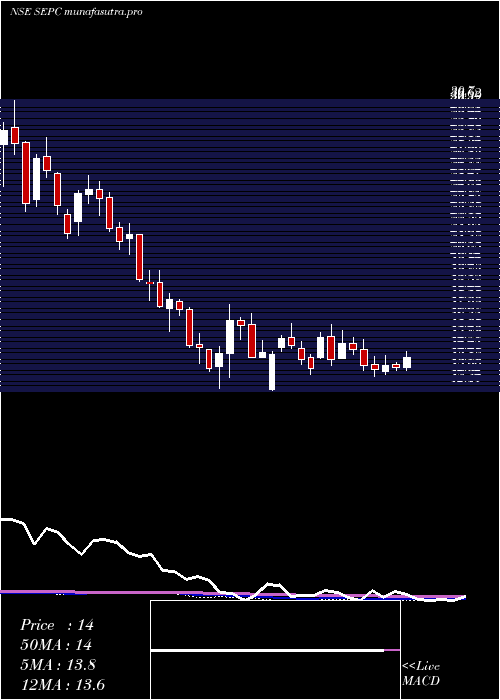
DMA SMA EMA moving averages of Sepc SEPC
DMA (daily moving average) of Sepc SEPC
| DMA period | DMA value | | 5 day DMA | 11.37 | | 12 day DMA | 11.44 | | 20 day DMA | 11.62 | | 35 day DMA | 11.93 | | 50 day DMA | 11.86 | | 100 day DMA | 12.42 | | 150 day DMA | 13.16 | | 200 day DMA | 13.95 | EMA (exponential moving average) of Sepc SEPC
| EMA period | EMA current | EMA prev | EMA prev2 | | 5 day EMA | 11.34 | 11.41 | 11.42 | | 12 day EMA | 11.48 | 11.53 | 11.55 | | 20 day EMA | 11.59 | 11.63 | 11.66 | | 35 day EMA | 11.66 | 11.69 | 11.71 | | 50 day EMA | 11.77 | 11.79 | 11.81 |
SMA (simple moving average) of Sepc SEPC
| SMA period | SMA current | SMA prev | SMA prev2 | | 5 day SMA | 11.37 | 11.4 | 11.4 | | 12 day SMA | 11.44 | 11.48 | 11.51 | | 20 day SMA | 11.62 | 11.66 | 11.71 | | 35 day SMA | 11.93 | 11.95 | 11.95 | | 50 day SMA | 11.86 | 11.86 | 11.86 | | 100 day SMA | 12.42 | 12.45 | 12.48 | | 150 day SMA | 13.16 | 13.2 | 13.23 | | 200 day SMA | 13.95 | 13.99 | 14.04 |
|
|
