SencoGold SENCO full analysis,charts,indicators,moving averages,SMA,DMA,EMA,ADX,MACD,RSISenco Gold SENCO WideScreen charts, DMA,SMA,EMA technical analysis, forecast prediction, by indicators ADX,MACD,RSI,CCI NSE stock exchange
Daily price and charts and targets SencoGold Strong Daily Stock price targets for SencoGold SENCO are 323.68 and 333.43 | Daily Target 1 | 316.53 | | Daily Target 2 | 321.07 | | Daily Target 3 | 326.28333333333 | | Daily Target 4 | 330.82 | | Daily Target 5 | 336.03 |
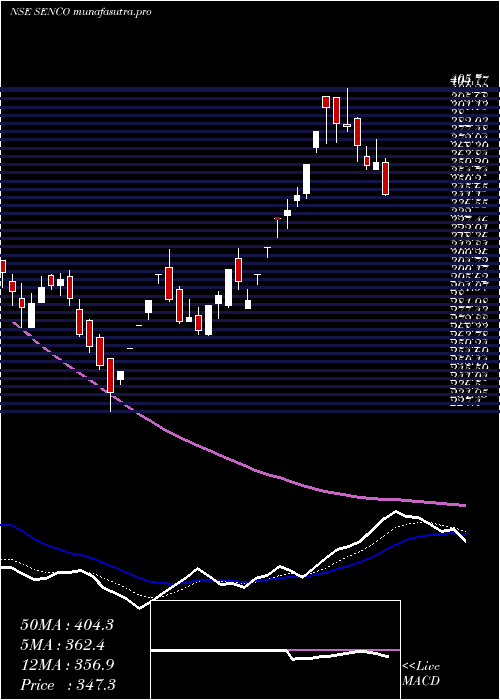
Daily price and volume Senco Gold
| Date |
Closing |
Open |
Range |
Volume |
Tue 28 October 2025 |
325.60 (1.02%) |
323.75 |
321.75 - 331.50 |
1.4831 times |
Mon 27 October 2025 |
322.30 (0.61%) |
321.80 |
319.10 - 325.55 |
1.39 times |
Fri 24 October 2025 |
320.35 (-2.38%) |
327.00 |
319.40 - 329.00 |
1.0698 times |
Thu 23 October 2025 |
328.15 (0.55%) |
329.15 |
326.35 - 335.85 |
1.151 times |
Tue 21 October 2025 |
326.35 (0.32%) |
327.75 |
324.70 - 329.95 |
0.2385 times |
Mon 20 October 2025 |
325.30 (3.25%) |
319.60 |
316.20 - 329.30 |
1.2423 times |
Fri 17 October 2025 |
315.05 (-0.72%) |
318.90 |
314.50 - 320.25 |
0.5848 times |
Thu 16 October 2025 |
317.35 (0.67%) |
319.00 |
316.55 - 320.40 |
1.1951 times |
Wed 15 October 2025 |
315.25 (-0.21%) |
317.70 |
311.55 - 320.50 |
0.9795 times |
Tue 14 October 2025 |
315.90 (-1.19%) |
321.20 |
313.70 - 321.20 |
0.6661 times |
Mon 13 October 2025 |
319.70 (-1.95%) |
327.00 |
317.30 - 328.70 |
1.6051 times |
Weekly price and charts SencoGold Strong weekly Stock price targets for SencoGold SENCO are 322.35 and 334.75 | Weekly Target 1 | 313 | | Weekly Target 2 | 319.3 | | Weekly Target 3 | 325.4 | | Weekly Target 4 | 331.7 | | Weekly Target 5 | 337.8 |
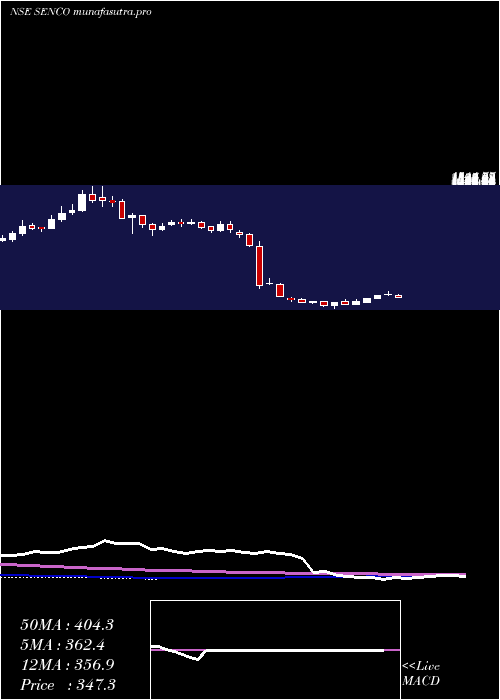
Weekly price and volumes for Senco Gold
| Date |
Closing |
Open |
Range |
Volume |
Tue 28 October 2025 |
325.60 (1.64%) |
321.80 |
319.10 - 331.50 |
0.7088 times |
Fri 24 October 2025 |
320.35 (1.68%) |
319.60 |
316.20 - 335.85 |
0.9132 times |
Fri 17 October 2025 |
315.05 (-3.37%) |
327.00 |
311.55 - 328.70 |
1.241 times |
Fri 10 October 2025 |
326.05 (-6.59%) |
353.40 |
323.50 - 366.70 |
1.8014 times |
Fri 03 October 2025 |
349.05 (3.15%) |
339.70 |
334.75 - 353.90 |
0.5786 times |
Fri 26 September 2025 |
338.40 (-9.34%) |
371.00 |
335.25 - 373.70 |
0.6476 times |
Fri 19 September 2025 |
373.25 (-0.33%) |
375.95 |
367.00 - 388.60 |
1.1242 times |
Fri 12 September 2025 |
374.50 (-2.66%) |
386.75 |
373.50 - 404.85 |
1.1868 times |
Fri 05 September 2025 |
384.75 (4.17%) |
371.60 |
368.30 - 398.45 |
1.0804 times |
Fri 29 August 2025 |
369.35 (-2.53%) |
380.00 |
367.00 - 382.90 |
0.718 times |
Fri 22 August 2025 |
378.95 (5%) |
368.45 |
364.00 - 389.00 |
1.8915 times |
Monthly price and charts SencoGold Strong monthly Stock price targets for SencoGold SENCO are 291 and 346.15 | Monthly Target 1 | 279.47 | | Monthly Target 2 | 302.53 | | Monthly Target 3 | 334.61666666667 | | Monthly Target 4 | 357.68 | | Monthly Target 5 | 389.77 |
Monthly price and volumes Senco Gold
| Date |
Closing |
Open |
Range |
Volume |
Tue 28 October 2025 |
325.60 (-5.2%) |
343.80 |
311.55 - 366.70 |
0.8045 times |
Tue 30 September 2025 |
343.45 (-7.01%) |
371.60 |
334.75 - 404.85 |
0.7043 times |
Fri 29 August 2025 |
369.35 (18.08%) |
312.60 |
307.55 - 389.00 |
1.292 times |
Thu 31 July 2025 |
312.80 (-8.87%) |
343.25 |
300.00 - 380.85 |
1.1022 times |
Mon 30 June 2025 |
343.25 (-9.92%) |
382.85 |
330.90 - 389.15 |
0.534 times |
Fri 30 May 2025 |
381.05 (9.72%) |
346.00 |
321.35 - 399.70 |
0.7227 times |
Wed 30 April 2025 |
347.30 (27.52%) |
270.00 |
269.10 - 405.70 |
1.2234 times |
Fri 28 March 2025 |
272.35 (-7.29%) |
290.00 |
227.40 - 316.90 |
1.2503 times |
Fri 28 February 2025 |
293.75 (-37.47%) |
495.40 |
285.70 - 546.65 |
1.8979 times |
Fri 31 January 2025 |
469.80 (-56.2%) |
1070.00 |
444.70 - 1164.50 |
0.4688 times |
Tue 31 December 2024 |
1072.55 (-6.84%) |
1152.00 |
1047.00 - 1192.00 |
0.5419 times |

DMA SMA EMA moving averages of Senco Gold SENCO
DMA (daily moving average) of Senco Gold SENCO
| DMA period | DMA value | | 5 day DMA | 324.55 | | 12 day DMA | 321.45 | | 20 day DMA | 329.99 | | 35 day DMA | 347.14 | | 50 day DMA | 356.13 | | 100 day DMA | 350.9 | | 150 day DMA | 347.57 | | 200 day DMA | 407.19 | EMA (exponential moving average) of Senco Gold SENCO
| EMA period | EMA current | EMA prev | EMA prev2 | | 5 day EMA | 323.75 | 322.83 | 323.1 | | 12 day EMA | 325.8 | 325.84 | 326.48 | | 20 day EMA | 331.19 | 331.78 | 332.78 | | 35 day EMA | 340.4 | 341.27 | 342.39 | | 50 day EMA | 351.35 | 352.4 | 353.63 |
SMA (simple moving average) of Senco Gold SENCO
| SMA period | SMA current | SMA prev | SMA prev2 | | 5 day SMA | 324.55 | 324.49 | 323.04 | | 12 day SMA | 321.45 | 321.38 | 322.81 | | 20 day SMA | 329.99 | 330.63 | 331.81 | | 35 day SMA | 347.14 | 348.83 | 350.63 | | 50 day SMA | 356.13 | 356.39 | 356.71 | | 100 day SMA | 350.9 | 351.37 | 351.92 | | 150 day SMA | 347.57 | 347.14 | 346.66 | | 200 day SMA | 407.19 | 411.06 | 415.12 |
|
|
