SemacConsultants SEMAC full analysis,charts,indicators,moving averages,SMA,DMA,EMA,ADX,MACD,RSISemac Consultants SEMAC WideScreen charts, DMA,SMA,EMA technical analysis, forecast prediction, by indicators ADX,MACD,RSI,CCI NSE stock exchange
Daily price and charts and targets SemacConsultants Strong Daily Stock price targets for SemacConsultants SEMAC are 399.08 and 411.08 | Daily Target 1 | 396.38 | | Daily Target 2 | 401.77 | | Daily Target 3 | 408.38333333333 | | Daily Target 4 | 413.77 | | Daily Target 5 | 420.38 |
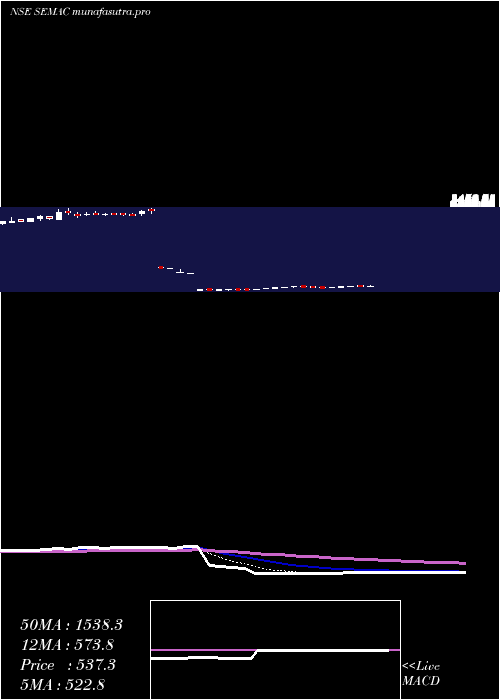
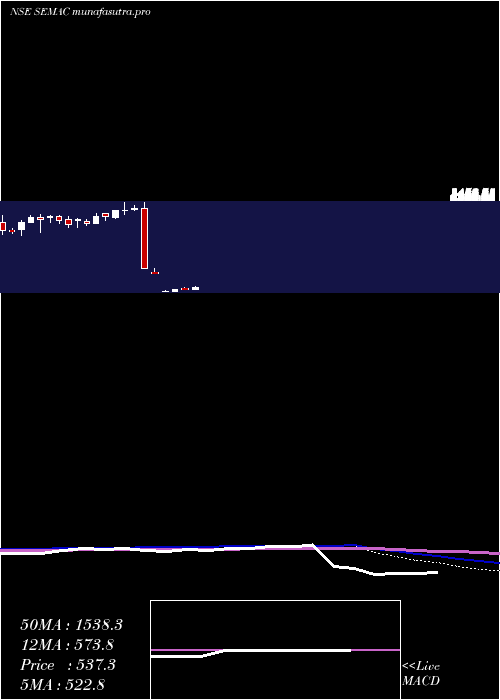
Daily price and volume Semac Consultants
| Date |
Closing |
Open |
Range |
Volume |
Thu 30 October 2025 |
407.15 (0.26%) |
415.00 |
403.00 - 415.00 |
0.6875 times |
Wed 29 October 2025 |
406.10 (-4.21%) |
430.00 |
404.95 - 430.00 |
1.1866 times |
Tue 28 October 2025 |
423.95 (-2.19%) |
433.00 |
420.00 - 442.00 |
0.1769 times |
Mon 27 October 2025 |
433.45 (-2.66%) |
460.00 |
430.55 - 460.00 |
0.4612 times |
Fri 24 October 2025 |
445.30 (-3.2%) |
462.00 |
441.00 - 462.00 |
0.8229 times |
Thu 23 October 2025 |
460.00 (-2.99%) |
467.00 |
455.10 - 484.40 |
4.2669 times |
Tue 21 October 2025 |
474.20 (2.76%) |
483.15 |
456.90 - 483.20 |
1.2634 times |
Mon 20 October 2025 |
461.45 (-0.4%) |
449.05 |
442.20 - 483.35 |
0.5136 times |
Fri 17 October 2025 |
463.30 (2.04%) |
450.50 |
450.50 - 466.40 |
0.1717 times |
Thu 16 October 2025 |
454.05 (3.09%) |
420.50 |
420.50 - 459.40 |
0.4493 times |
Wed 15 October 2025 |
440.45 (-4.02%) |
475.00 |
436.10 - 475.00 |
0.6034 times |
Weekly price and charts SemacConsultants Strong weekly Stock price targets for SemacConsultants SEMAC are 376.58 and 433.58 | Weekly Target 1 | 366.38 | | Weekly Target 2 | 386.77 | | Weekly Target 3 | 423.38333333333 | | Weekly Target 4 | 443.77 | | Weekly Target 5 | 480.38 |
Weekly price and volumes for Semac Consultants
| Date |
Closing |
Open |
Range |
Volume |
Thu 30 October 2025 |
407.15 (-8.57%) |
460.00 |
403.00 - 460.00 |
0.1965 times |
Fri 24 October 2025 |
445.30 (-3.89%) |
449.05 |
441.00 - 484.40 |
0.5372 times |
Fri 17 October 2025 |
463.30 (-13.76%) |
490.00 |
420.50 - 492.95 |
0.1518 times |
Fri 11 July 2025 |
537.25 (12.11%) |
479.95 |
471.20 - 558.95 |
1.2937 times |
Fri 04 July 2025 |
479.20 (2.33%) |
489.95 |
474.85 - 542.05 |
1.2435 times |
Fri 27 June 2025 |
468.30 (16.8%) |
403.95 |
390.45 - 468.30 |
0.7396 times |
Fri 20 June 2025 |
400.95 (-60.69%) |
390.00 |
385.00 - 419.80 |
0.9838 times |
Wed 22 May 2024 |
1020.00 (-14.49%) |
1073.65 |
1020.00 - 1185.00 |
3.5668 times |
Sat 18 May 2024 |
1192.90 (-63.59%) |
3276.00 |
1192.90 - 3484.90 |
0.8974 times |
Fri 26 April 2024 |
3276.35 (2.04%) |
3244.95 |
3205.00 - 3393.30 |
0.3896 times |
Fri 19 April 2024 |
3210.70 (0.4%) |
3197.85 |
3078.00 - 3479.00 |
0.6526 times |
Monthly price and charts SemacConsultants Strong monthly Stock price targets for SemacConsultants SEMAC are 360.1 and 450.05 | Monthly Target 1 | 344.42 | | Monthly Target 2 | 375.78 | | Monthly Target 3 | 434.36666666667 | | Monthly Target 4 | 465.73 | | Monthly Target 5 | 524.32 |
Monthly price and volumes Semac Consultants
| Date |
Closing |
Open |
Range |
Volume |
Thu 30 October 2025 |
407.15 (-24.22%) |
490.00 |
403.00 - 492.95 |
0.4461 times |
Fri 11 July 2025 |
537.25 (9.26%) |
516.20 |
471.20 - 558.95 |
1.2294 times |
Mon 30 June 2025 |
491.70 (-51.79%) |
390.00 |
385.00 - 491.70 |
0.9168 times |
Wed 22 May 2024 |
1020.00 (-69.83%) |
3440.00 |
1020.00 - 3484.90 |
2.1541 times |
Tue 30 April 2024 |
3381.35 (12.63%) |
3100.00 |
2850.55 - 3479.00 |
1.2754 times |
Thu 28 March 2024 |
3002.20 (5.37%) |
2800.00 |
2605.05 - 3122.00 |
0.5459 times |
Thu 29 February 2024 |
2849.10 (7.25%) |
2651.40 |
2445.05 - 3060.00 |
0.9701 times |
Wed 31 January 2024 |
2656.60 (0%) |
2788.00 |
2325.05 - 3049.20 |
0.4621 times |
Thu 30 October 2025 |
(0%) |
|
- |
0 times |

DMA SMA EMA moving averages of Semac Consultants SEMAC
DMA (daily moving average) of Semac Consultants SEMAC
| DMA period | DMA value | | 5 day DMA | 423.19 | | 12 day DMA | 444.03 | | 20 day DMA | 468.75 | | 35 day DMA | 512.96 | | 50 day DMA | 1296.26 | | 100 day DMA | 2080.93 | | 150 day DMA | | | 200 day DMA | | EMA (exponential moving average) of Semac Consultants SEMAC
| EMA period | EMA current | EMA prev | EMA prev2 | | 5 day EMA | 422.16 | 429.67 | 441.46 | | 12 day EMA | 450.81 | 458.75 | 468.32 | | 20 day EMA | 538.17 | 551.96 | 567.31 | | 35 day EMA | 953.2 | 985.35 | 1019.45 | | 50 day EMA | 1348.14 | 1386.53 | 1426.53 |
SMA (simple moving average) of Semac Consultants SEMAC
| SMA period | SMA current | SMA prev | SMA prev2 | | 5 day SMA | 423.19 | 433.76 | 447.38 | | 12 day SMA | 444.03 | 450.05 | 460.98 | | 20 day SMA | 468.75 | 474.56 | 480.06 | | 35 day SMA | 512.96 | 537.2 | 623.41 | | 50 day SMA | 1296.26 | 1348.16 | 1400.11 | | 100 day SMA | 2080.93 | 2101.7 | 2122.31 | | 150 day SMA | | 200 day SMA |
|
|
