SungarnerEnergies SEL_SM full analysis,charts,indicators,moving averages,SMA,DMA,EMA,ADX,MACD,RSISungarner Energies SEL_SM WideScreen charts, DMA,SMA,EMA technical analysis, forecast prediction, by indicators ADX,MACD,RSI,CCI NSE stock exchange
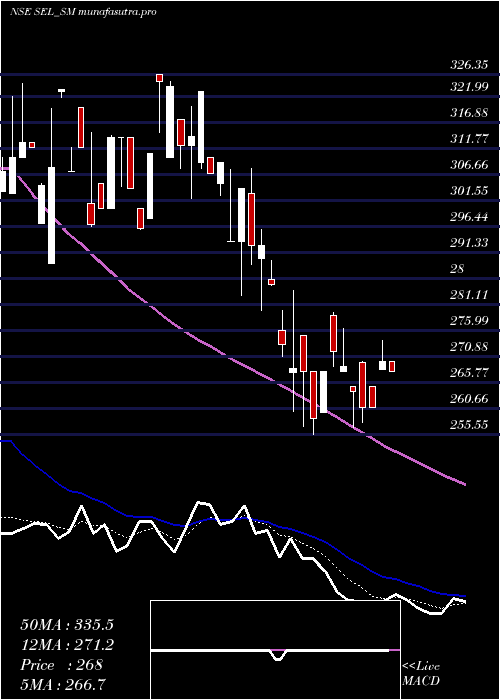
Daily price and charts and targets SungarnerEnergies Strong Daily Stock price targets for SungarnerEnergies SEL_SM are 259.25 and 260.75 | Daily Target 1 | 258 | | Daily Target 2 | 259 | | Daily Target 3 | 259.5 | | Daily Target 4 | 260.5 | | Daily Target 5 | 261 |
Daily price and volume Sungarner Energies
| Date |
Closing |
Open |
Range |
Volume |
Tue 28 October 2025 |
260.00 (0.58%) |
258.50 |
258.50 - 260.00 |
0.2564 times |
Mon 27 October 2025 |
258.50 (7.71%) |
245.00 |
245.00 - 259.90 |
3.4615 times |
Fri 24 October 2025 |
240.00 (1.69%) |
240.00 |
240.00 - 240.00 |
0.3846 times |
Thu 23 October 2025 |
236.00 (0%) |
236.00 |
236.00 - 236.00 |
0.2564 times |
Mon 20 October 2025 |
236.00 (2.61%) |
230.00 |
230.00 - 236.00 |
0.2564 times |
Fri 17 October 2025 |
230.00 (2.43%) |
230.00 |
230.00 - 230.00 |
0.3846 times |
Thu 16 October 2025 |
224.55 (0.02%) |
224.50 |
224.50 - 230.00 |
1.4103 times |
Wed 15 October 2025 |
224.50 (0.38%) |
225.00 |
222.90 - 227.50 |
1.5385 times |
Tue 14 October 2025 |
223.65 (-7.58%) |
223.10 |
222.00 - 224.00 |
1.2821 times |
Mon 13 October 2025 |
242.00 (1.68%) |
244.00 |
231.25 - 244.00 |
0.7692 times |
Fri 10 October 2025 |
238.00 (3.48%) |
230.05 |
230.05 - 242.00 |
1.6667 times |
Weekly price and charts SungarnerEnergies Strong weekly Stock price targets for SungarnerEnergies SEL_SM are 252.5 and 267.5 | Weekly Target 1 | 240 | | Weekly Target 2 | 250 | | Weekly Target 3 | 255 | | Weekly Target 4 | 265 | | Weekly Target 5 | 270 |
Weekly price and volumes for Sungarner Energies
| Date |
Closing |
Open |
Range |
Volume |
Tue 28 October 2025 |
260.00 (8.33%) |
245.00 |
245.00 - 260.00 |
0.736 times |
Fri 24 October 2025 |
240.00 (4.35%) |
230.00 |
230.00 - 240.00 |
0.1777 times |
Fri 17 October 2025 |
230.00 (-3.36%) |
244.00 |
222.00 - 244.00 |
1.066 times |
Fri 10 October 2025 |
238.00 (2.59%) |
211.00 |
211.00 - 242.00 |
1.2944 times |
Fri 03 October 2025 |
232.00 (-5.88%) |
245.00 |
231.10 - 245.00 |
0.3553 times |
Fri 26 September 2025 |
246.50 (0.98%) |
244.10 |
233.00 - 254.00 |
0.9391 times |
Fri 19 September 2025 |
244.10 (2.41%) |
233.10 |
232.05 - 270.00 |
1.2944 times |
Fri 12 September 2025 |
238.35 (-5.42%) |
241.10 |
228.00 - 265.00 |
2.3858 times |
Fri 05 September 2025 |
252.00 (2.86%) |
259.90 |
236.00 - 261.40 |
1.2183 times |
Fri 29 August 2025 |
245.00 (-5.7%) |
277.00 |
240.00 - 277.00 |
0.533 times |
Fri 22 August 2025 |
259.80 (3.82%) |
251.00 |
240.00 - 268.00 |
0.736 times |
Monthly price and charts SungarnerEnergies Strong monthly Stock price targets for SungarnerEnergies SEL_SM are 235.5 and 284.5 | Monthly Target 1 | 194.67 | | Monthly Target 2 | 227.33 | | Monthly Target 3 | 243.66666666667 | | Monthly Target 4 | 276.33 | | Monthly Target 5 | 292.67 |
Monthly price and volumes Sungarner Energies
| Date |
Closing |
Open |
Range |
Volume |
Tue 28 October 2025 |
260.00 (8.33%) |
240.00 |
211.00 - 260.00 |
0.2799 times |
Mon 29 September 2025 |
240.00 (-2.04%) |
259.90 |
228.00 - 270.00 |
0.4935 times |
Fri 29 August 2025 |
245.00 (3.38%) |
226.00 |
223.50 - 277.95 |
0.4022 times |
Thu 31 July 2025 |
237.00 (-13.28%) |
267.85 |
236.10 - 283.95 |
0.4499 times |
Mon 30 June 2025 |
273.30 (-12.4%) |
301.00 |
270.85 - 326.35 |
0.7755 times |
Fri 30 May 2025 |
312.00 (-44.09%) |
310.00 |
277.40 - 337.10 |
0.3919 times |
Tue 08 October 2024 |
558.00 (-12.72%) |
665.00 |
505.30 - 665.00 |
0.4437 times |
Mon 30 September 2024 |
639.35 (-10.57%) |
714.95 |
620.05 - 835.65 |
1.3311 times |
Fri 30 August 2024 |
714.95 (48.1%) |
485.00 |
457.90 - 909.20 |
3.4294 times |
Wed 31 July 2024 |
482.75 (18.35%) |
407.90 |
353.35 - 482.75 |
2.0029 times |
Fri 28 June 2024 |
407.90 (0.6%) |
421.50 |
354.35 - 478.00 |
1.7458 times |
DMA SMA EMA moving averages of Sungarner Energies SEL_SM
DMA (daily moving average) of Sungarner Energies SEL_SM
| DMA period | DMA value | | 5 day DMA | 246.1 | | 12 day DMA | 236.93 | | 20 day DMA | 236.42 | | 35 day DMA | 242.19 | | 50 day DMA | 246.03 | | 100 day DMA | 261.91 | | 150 day DMA | 368.07 | | 200 day DMA | 389.46 | EMA (exponential moving average) of Sungarner Energies SEL_SM
| EMA period | EMA current | EMA prev | EMA prev2 | | 5 day EMA | 248.63 | 242.94 | 235.16 | | 12 day EMA | 241.49 | 238.12 | 234.41 | | 20 day EMA | 240.5 | 238.45 | 236.34 | | 35 day EMA | 241.41 | 240.32 | 239.25 | | 50 day EMA | 245.09 | 244.48 | 243.91 |
SMA (simple moving average) of Sungarner Energies SEL_SM
| SMA period | SMA current | SMA prev | SMA prev2 | | 5 day SMA | 246.1 | 240.1 | 233.31 | | 12 day SMA | 236.93 | 234.52 | 231.81 | | 20 day SMA | 236.42 | 236.09 | 235.67 | | 35 day SMA | 242.19 | 241.76 | 241.84 | | 50 day SMA | 246.03 | 245.42 | 244.85 | | 100 day SMA | 261.91 | 262.39 | 262.85 | | 150 day SMA | 368.07 | 371.44 | 374.57 | | 200 day SMA | 389.46 | 390.04 | 390.61 |
|
|
