SelManufacturing SELMC full analysis,charts,indicators,moving averages,SMA,DMA,EMA,ADX,MACD,RSISel Manufacturing SELMC WideScreen charts, DMA,SMA,EMA technical analysis, forecast prediction, by indicators ADX,MACD,RSI,CCI NSE stock exchange
Daily price and charts and targets SelManufacturing Strong Daily Stock price targets for SelManufacturing SELMC are 37.17 and 37.17 | Daily Target 1 | 37.17 | | Daily Target 2 | 37.17 | | Daily Target 3 | 37.17 | | Daily Target 4 | 37.17 | | Daily Target 5 | 37.17 |
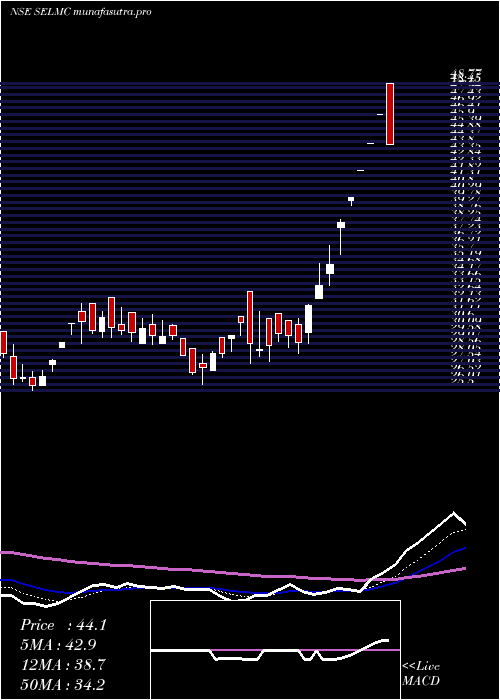
Daily price and volume Sel Manufacturing
| Date |
Closing |
Open |
Range |
Volume |
Tue 28 October 2025 |
37.17 (-5.01%) |
37.17 |
37.17 - 37.17 |
0.3145 times |
Mon 27 October 2025 |
39.13 (-5%) |
39.13 |
39.13 - 39.13 |
0.2343 times |
Fri 24 October 2025 |
41.19 (-5%) |
41.19 |
41.19 - 41.21 |
1.824 times |
Thu 23 October 2025 |
43.36 (4.99%) |
43.36 |
43.36 - 43.36 |
0.6077 times |
Tue 21 October 2025 |
41.30 (4.98%) |
41.30 |
41.30 - 41.30 |
0.6794 times |
Mon 20 October 2025 |
39.34 (9.98%) |
39.34 |
38.50 - 39.34 |
1.7596 times |
Fri 17 October 2025 |
35.77 (9.99%) |
33.33 |
33.33 - 35.77 |
2.2872 times |
Thu 16 October 2025 |
32.52 (9.98%) |
30.00 |
29.75 - 32.52 |
1.1889 times |
Wed 15 October 2025 |
29.57 (0.03%) |
30.16 |
29.00 - 30.97 |
0.8164 times |
Tue 14 October 2025 |
29.56 (-1.17%) |
29.91 |
29.22 - 30.50 |
0.288 times |
Mon 13 October 2025 |
29.91 (-1.45%) |
30.99 |
29.53 - 30.99 |
0.2661 times |
Weekly price and charts SelManufacturing Strong weekly Stock price targets for SelManufacturing SELMC are 36.19 and 38.15 | Weekly Target 1 | 35.86 | | Weekly Target 2 | 36.52 | | Weekly Target 3 | 37.823333333333 | | Weekly Target 4 | 38.48 | | Weekly Target 5 | 39.78 |
Weekly price and volumes for Sel Manufacturing
| Date |
Closing |
Open |
Range |
Volume |
Tue 28 October 2025 |
37.17 (-9.76%) |
39.13 |
37.17 - 39.13 |
0.2926 times |
Fri 24 October 2025 |
41.19 (15.15%) |
39.34 |
38.50 - 43.36 |
2.5968 times |
Fri 17 October 2025 |
35.77 (17.86%) |
30.99 |
29.00 - 35.77 |
2.5841 times |
Fri 10 October 2025 |
30.35 (-0.56%) |
30.92 |
29.12 - 31.39 |
0.5988 times |
Fri 03 October 2025 |
30.52 (5.57%) |
29.05 |
28.91 - 30.95 |
0.62 times |
Fri 26 September 2025 |
28.91 (-7.19%) |
31.49 |
28.47 - 31.49 |
0.952 times |
Fri 19 September 2025 |
31.15 (3.04%) |
30.08 |
30.00 - 32.39 |
0.6598 times |
Fri 12 September 2025 |
30.23 (0.93%) |
30.99 |
29.50 - 31.65 |
0.6047 times |
Fri 05 September 2025 |
29.95 (1.84%) |
29.99 |
28.97 - 31.80 |
0.7248 times |
Fri 29 August 2025 |
29.41 (-5.92%) |
30.50 |
28.60 - 31.89 |
0.3665 times |
Fri 22 August 2025 |
31.26 (-29.15%) |
30.25 |
28.70 - 32.20 |
0.7202 times |

Monthly price and charts SelManufacturing Strong monthly Stock price targets for SelManufacturing SELMC are 33.09 and 47.45 | Monthly Target 1 | 22.15 | | Monthly Target 2 | 29.66 | | Monthly Target 3 | 36.51 | | Monthly Target 4 | 44.02 | | Monthly Target 5 | 50.87 |
Monthly price and volumes Sel Manufacturing
| Date |
Closing |
Open |
Range |
Volume |
Tue 28 October 2025 |
37.17 (24.9%) |
29.75 |
29.00 - 43.36 |
0.3883 times |
Tue 30 September 2025 |
29.76 (1.19%) |
29.99 |
28.47 - 32.39 |
0.1876 times |
Fri 29 August 2025 |
29.41 (-33.34%) |
30.25 |
28.60 - 32.20 |
0.065 times |
Wed 30 April 2025 |
44.12 (61.97%) |
27.00 |
27.00 - 48.77 |
0.6421 times |
Fri 28 March 2025 |
27.24 (2.91%) |
26.46 |
25.50 - 32.58 |
0.5902 times |
Fri 28 February 2025 |
26.47 (-23.3%) |
36.00 |
26.00 - 38.69 |
0.4159 times |
Fri 31 January 2025 |
34.51 (-23.05%) |
45.01 |
31.55 - 47.95 |
0.6987 times |
Tue 31 December 2024 |
44.85 (-14.24%) |
54.50 |
44.00 - 54.91 |
1.3339 times |
Fri 29 November 2024 |
52.30 (-22.52%) |
45.23 |
40.01 - 52.30 |
0.3053 times |
Tue 13 August 2024 |
67.50 (16.96%) |
58.86 |
46.09 - 89.21 |
5.373 times |
Wed 31 July 2024 |
57.71 (-4.31%) |
62.50 |
57.15 - 63.37 |
0.6128 times |

DMA SMA EMA moving averages of Sel Manufacturing SELMC
DMA (daily moving average) of Sel Manufacturing SELMC
| DMA period | DMA value | | 5 day DMA | 40.43 | | 12 day DMA | 35.76 | | 20 day DMA | 33.5 | | 35 day DMA | 32.21 | | 50 day DMA | 31.93 | | 100 day DMA | 31.6 | | 150 day DMA | 35.11 | | 200 day DMA | 40.93 | EMA (exponential moving average) of Sel Manufacturing SELMC
| EMA period | EMA current | EMA prev | EMA prev2 | | 5 day EMA | 38.76 | 39.56 | 39.77 | | 12 day EMA | 36.74 | 36.66 | 36.21 | | 20 day EMA | 35.13 | 34.92 | 34.48 | | 35 day EMA | 34.07 | 33.89 | 33.58 | | 50 day EMA | 33.6 | 33.45 | 33.22 |
SMA (simple moving average) of Sel Manufacturing SELMC
| SMA period | SMA current | SMA prev | SMA prev2 | | 5 day SMA | 40.43 | 40.86 | 40.19 | | 12 day SMA | 35.76 | 35.18 | 34.45 | | 20 day SMA | 33.5 | 33.08 | 32.63 | | 35 day SMA | 32.21 | 32 | 31.75 | | 50 day SMA | 31.93 | 32.12 | 32.22 | | 100 day SMA | 31.6 | 31.59 | 31.57 | | 150 day SMA | 35.11 | 35.21 | 35.27 | | 200 day SMA | 40.93 | 41.07 | 41.2 |
|
|
