Seamec SEAMECLTD full analysis,charts,indicators,moving averages,SMA,DMA,EMA,ADX,MACD,RSISeamec SEAMECLTD WideScreen charts, DMA,SMA,EMA technical analysis, forecast prediction, by indicators ADX,MACD,RSI,CCI NSE stock exchange
operates under Shipping sector
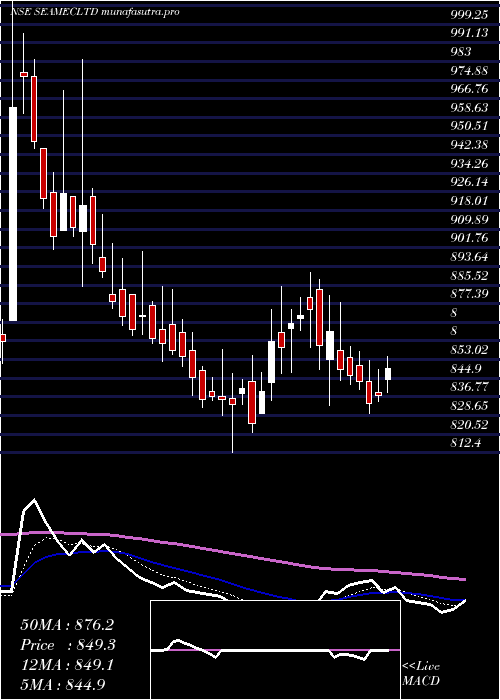
Daily price and charts and targets Seamec Strong Daily Stock price targets for Seamec SEAMECLTD are 846.83 and 868.63 | Daily Target 1 | 841.35 | | Daily Target 2 | 852.3 | | Daily Target 3 | 863.15 | | Daily Target 4 | 874.1 | | Daily Target 5 | 884.95 |
Daily price and volume Seamec
| Date |
Closing |
Open |
Range |
Volume |
Wed 29 October 2025 |
863.25 (0.79%) |
874.00 |
852.20 - 874.00 |
2.0817 times |
Tue 28 October 2025 |
856.45 (-1.02%) |
865.25 |
852.65 - 874.65 |
0.4648 times |
Mon 27 October 2025 |
865.25 (0.75%) |
862.25 |
860.00 - 868.20 |
0.5702 times |
Fri 24 October 2025 |
858.85 (-0.14%) |
860.05 |
849.60 - 868.90 |
0.6594 times |
Thu 23 October 2025 |
860.05 (-0.21%) |
863.55 |
852.00 - 875.95 |
1.0406 times |
Tue 21 October 2025 |
861.85 (1.96%) |
846.45 |
846.45 - 869.90 |
0.3041 times |
Mon 20 October 2025 |
845.25 (0.52%) |
835.00 |
824.70 - 850.00 |
1.6812 times |
Fri 17 October 2025 |
840.90 (-1.76%) |
856.05 |
838.00 - 858.65 |
0.8631 times |
Thu 16 October 2025 |
856.00 (0.24%) |
857.35 |
851.05 - 867.95 |
0.8466 times |
Wed 15 October 2025 |
853.95 (-0.91%) |
852.50 |
852.00 - 868.70 |
1.4883 times |
Tue 14 October 2025 |
861.80 (-1.58%) |
885.20 |
851.35 - 885.20 |
2.0903 times |
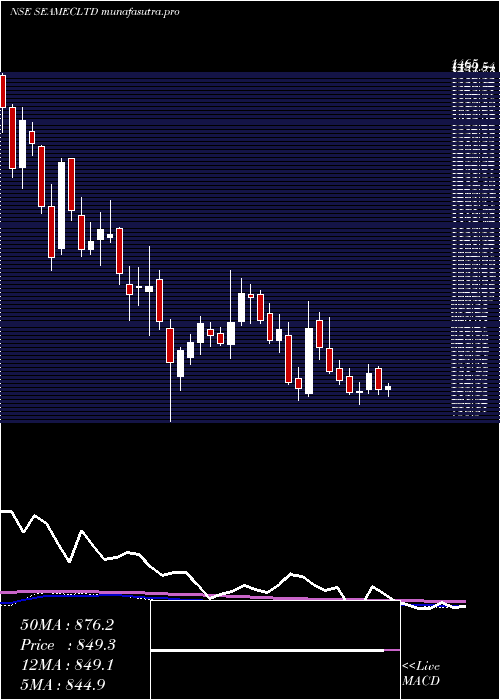
Weekly price and charts Seamec Strong weekly Stock price targets for Seamec SEAMECLTD are 857.73 and 880.18 | Weekly Target 1 | 840.92 | | Weekly Target 2 | 852.08 | | Weekly Target 3 | 863.36666666667 | | Weekly Target 4 | 874.53 | | Weekly Target 5 | 885.82 |
Weekly price and volumes for Seamec
| Date |
Closing |
Open |
Range |
Volume |
Wed 29 October 2025 |
863.25 (0.51%) |
862.25 |
852.20 - 874.65 |
0.1526 times |
Fri 24 October 2025 |
858.85 (2.13%) |
835.00 |
824.70 - 875.95 |
0.1804 times |
Fri 17 October 2025 |
840.90 (-4.01%) |
876.05 |
838.00 - 885.20 |
0.3168 times |
Fri 10 October 2025 |
876.05 (-3.45%) |
917.00 |
848.80 - 917.00 |
0.8003 times |
Fri 03 October 2025 |
907.40 (0.37%) |
900.00 |
894.20 - 928.90 |
0.4412 times |
Fri 26 September 2025 |
904.05 (-4.14%) |
953.00 |
901.25 - 974.00 |
0.6459 times |
Fri 19 September 2025 |
943.05 (1.45%) |
932.95 |
927.60 - 974.45 |
0.6334 times |
Fri 12 September 2025 |
929.60 (0.36%) |
926.30 |
896.85 - 985.00 |
1.6298 times |
Fri 05 September 2025 |
926.30 (-6.25%) |
995.00 |
924.10 - 1009.00 |
1.9589 times |
Fri 29 August 2025 |
988.10 (10.06%) |
909.45 |
903.80 - 1006.15 |
3.2407 times |
Fri 22 August 2025 |
897.80 (4.79%) |
876.50 |
845.30 - 918.00 |
1.3125 times |
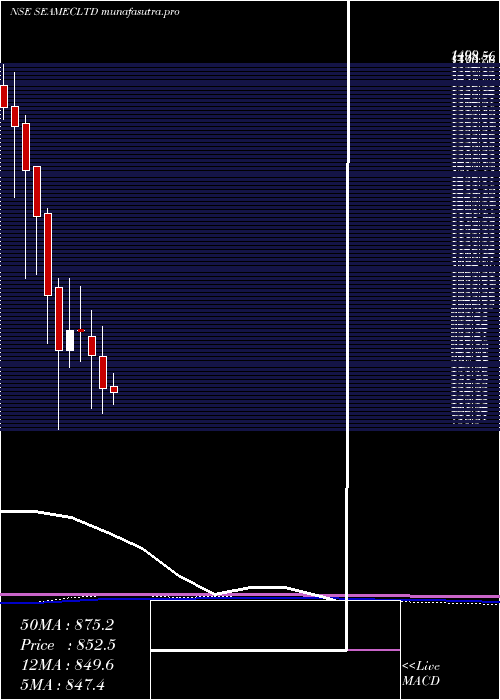
Monthly price and charts Seamec Strong monthly Stock price targets for Seamec SEAMECLTD are 796.85 and 891.1 | Monthly Target 1 | 774.72 | | Monthly Target 2 | 818.98 | | Monthly Target 3 | 868.96666666667 | | Monthly Target 4 | 913.23 | | Monthly Target 5 | 963.22 |
Monthly price and volumes Seamec
| Date |
Closing |
Open |
Range |
Volume |
Wed 29 October 2025 |
863.25 (-5.75%) |
917.70 |
824.70 - 918.95 |
0.4918 times |
Tue 30 September 2025 |
915.90 (-7.31%) |
995.00 |
894.20 - 1009.00 |
1.6214 times |
Fri 29 August 2025 |
988.10 (24.11%) |
800.10 |
752.55 - 1006.15 |
2.2219 times |
Thu 31 July 2025 |
796.15 (-7.54%) |
865.00 |
766.20 - 891.00 |
0.6833 times |
Mon 30 June 2025 |
861.10 (-6.95%) |
924.00 |
812.40 - 984.00 |
0.6769 times |
Fri 30 May 2025 |
925.45 (-5.06%) |
963.00 |
822.00 - 1015.50 |
1.0217 times |
Wed 30 April 2025 |
974.75 (-0.07%) |
975.70 |
915.00 - 1061.90 |
0.4499 times |
Fri 28 March 2025 |
975.40 (4.29%) |
935.10 |
903.00 - 1078.00 |
1.2072 times |
Fri 28 February 2025 |
935.30 (-10.5%) |
1060.00 |
780.50 - 1077.00 |
0.8436 times |
Fri 31 January 2025 |
1045.05 (-12.93%) |
1206.50 |
950.00 - 1216.00 |
0.7822 times |
Tue 31 December 2024 |
1200.20 (-6.99%) |
1298.00 |
1086.50 - 1298.00 |
0.5232 times |
DMA SMA EMA moving averages of Seamec SEAMECLTD
DMA (daily moving average) of Seamec SEAMECLTD
| DMA period | DMA value | | 5 day DMA | 860.77 | | 12 day DMA | 858.27 | | 20 day DMA | 872.02 | | 35 day DMA | 897.68 | | 50 day DMA | 903.21 | | 100 day DMA | 871.08 | | 150 day DMA | 893.89 | | 200 day DMA | 914.5 | EMA (exponential moving average) of Seamec SEAMECLTD
| EMA period | EMA current | EMA prev | EMA prev2 | | 5 day EMA | 860.36 | 858.92 | 860.16 | | 12 day EMA | 863.88 | 863.99 | 865.36 | | 20 day EMA | 871.89 | 872.8 | 874.52 | | 35 day EMA | 880.49 | 881.5 | 882.98 | | 50 day EMA | 892.3 | 893.49 | 895 |
SMA (simple moving average) of Seamec SEAMECLTD
| SMA period | SMA current | SMA prev | SMA prev2 | | 5 day SMA | 860.77 | 860.49 | 858.25 | | 12 day SMA | 858.27 | 859.34 | 860.14 | | 20 day SMA | 872.02 | 874.04 | 876.42 | | 35 day SMA | 897.68 | 899.29 | 901.28 | | 50 day SMA | 903.21 | 903.08 | 902.87 | | 100 day SMA | 871.08 | 871.36 | 871.83 | | 150 day SMA | 893.89 | 894.39 | 894.92 | | 200 day SMA | 914.5 | 915.91 | 917.24 |
|
|
