SecRed SCLZC26_NB full analysis,charts,indicators,moving averages,SMA,DMA,EMA,ADX,MACD,RSISec Red SCLZC26_NB WideScreen charts, DMA,SMA,EMA technical analysis, forecast prediction, by indicators ADX,MACD,RSI,CCI NSE stock exchange
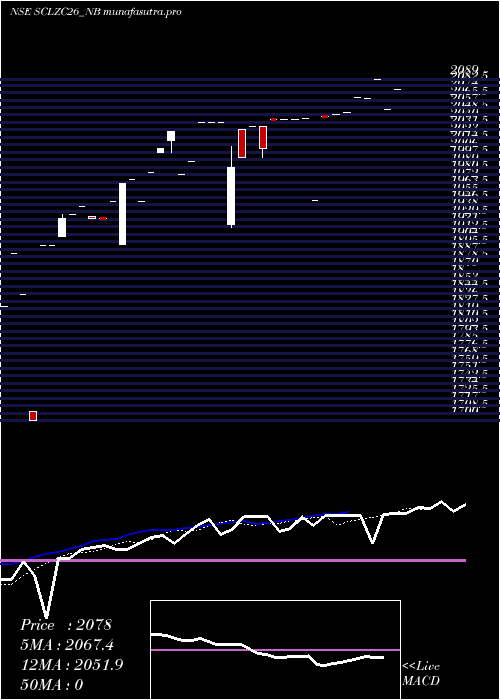
Daily price and charts and targets SecRed Strong Daily Stock price targets for SecRed SCLZC26_NB are 2096.11 and 2181 | Daily Target 1 | 2025.36 | | Daily Target 2 | 2081.96 | | Daily Target 3 | 2110.2533333333 | | Daily Target 4 | 2166.85 | | Daily Target 5 | 2195.14 |
Daily price and volume Sec Red
| Date |
Closing |
Open |
Range |
Volume |
Fri 24 October 2025 |
2138.55 (0.3%) |
2053.66 |
2053.66 - 2138.55 |
3.5374 times |
Thu 23 October 2025 |
2132.24 (0.17%) |
2132.24 |
2132.24 - 2132.24 |
0.068 times |
Mon 20 October 2025 |
2128.55 (0.14%) |
2128.55 |
2128.55 - 2128.55 |
1.4966 times |
Fri 17 October 2025 |
2125.55 (0%) |
2125.55 |
2125.55 - 2125.55 |
1.0884 times |
Wed 15 October 2025 |
2125.55 (0%) |
2125.55 |
2125.55 - 2125.55 |
0.3401 times |
Tue 14 October 2025 |
2125.55 (1.7%) |
2125.55 |
2125.55 - 2125.55 |
0.3401 times |
Mon 13 October 2025 |
2090.00 (-0.36%) |
2090.00 |
2090.00 - 2090.00 |
0.068 times |
Fri 10 October 2025 |
2097.60 (2.29%) |
2097.80 |
2097.60 - 2097.80 |
1.4966 times |
Wed 08 October 2025 |
2050.65 (-0.15%) |
2050.65 |
2050.65 - 2050.65 |
0.2041 times |
Tue 07 October 2025 |
2053.65 (-3.06%) |
2121.55 |
2053.65 - 2121.55 |
1.3605 times |
Wed 01 October 2025 |
2118.55 (1.17%) |
2118.55 |
2118.55 - 2118.55 |
0.3401 times |
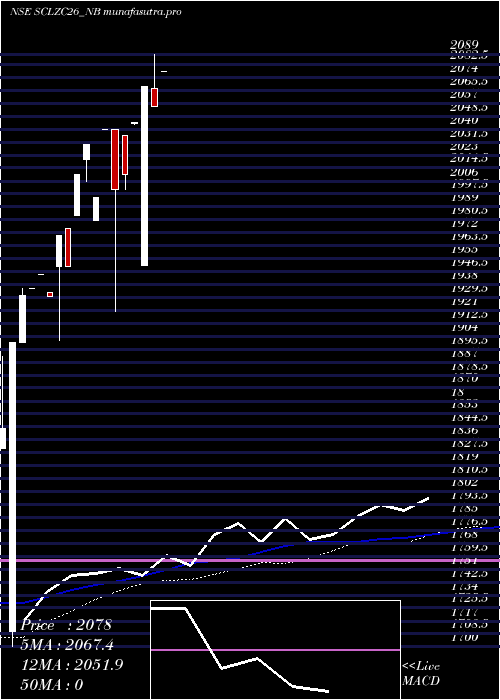
Weekly price and charts SecRed Strong weekly Stock price targets for SecRed SCLZC26_NB are 2096.11 and 2181 | Weekly Target 1 | 2025.36 | | Weekly Target 2 | 2081.96 | | Weekly Target 3 | 2110.2533333333 | | Weekly Target 4 | 2166.85 | | Weekly Target 5 | 2195.14 |
Weekly price and volumes for Sec Red
| Date |
Closing |
Open |
Range |
Volume |
Fri 24 October 2025 |
2138.55 (0.61%) |
2128.55 |
2053.66 - 2138.55 |
0.6122 times |
Fri 17 October 2025 |
2125.55 (1.33%) |
2090.00 |
2090.00 - 2125.55 |
0.2204 times |
Fri 10 October 2025 |
2097.60 (-0.99%) |
2121.55 |
2050.65 - 2121.55 |
0.3673 times |
Wed 01 October 2025 |
2118.55 (3.17%) |
2094.00 |
2094.00 - 2118.55 |
0.1633 times |
Fri 26 September 2025 |
2053.36 (-3.14%) |
2021.65 |
2021.65 - 2108.00 |
1.9837 times |
Tue 16 September 2025 |
2120.00 (0.95%) |
2120.00 |
2120.00 - 2120.00 |
0.0082 times |
Fri 12 September 2025 |
2100.00 (-0.47%) |
2110.00 |
2086.00 - 2110.00 |
2.9796 times |
Tue 02 September 2025 |
2110.00 (0.52%) |
2021.00 |
2021.00 - 2110.00 |
0.3673 times |
Fri 22 August 2025 |
2099.00 (0.43%) |
2100.00 |
2021.00 - 2110.00 |
2.1714 times |
Thu 14 August 2025 |
2090.00 (1.31%) |
2084.00 |
2083.98 - 2090.00 |
1.1265 times |
Fri 08 August 2025 |
2063.00 (4.42%) |
2089.00 |
1982.02 - 2089.00 |
6.6857 times |
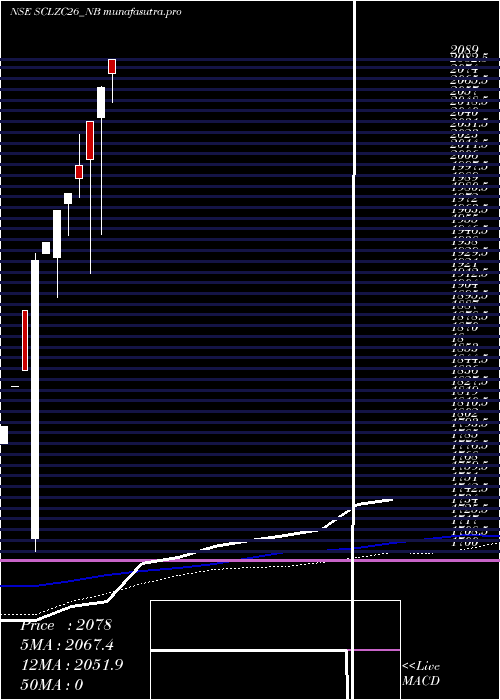
Monthly price and charts SecRed Strong monthly Stock price targets for SecRed SCLZC26_NB are 2094.6 and 2182.5 | Monthly Target 1 | 2021.35 | | Monthly Target 2 | 2079.95 | | Monthly Target 3 | 2109.25 | | Monthly Target 4 | 2167.85 | | Monthly Target 5 | 2197.15 |
Monthly price and volumes Sec Red
| Date |
Closing |
Open |
Range |
Volume |
Fri 24 October 2025 |
2138.55 (2.13%) |
2118.55 |
2050.65 - 2138.55 |
0.3957 times |
Tue 30 September 2025 |
2094.00 (2.63%) |
2110.00 |
2021.65 - 2120.00 |
1.6298 times |
Mon 25 August 2025 |
2040.25 (3.27%) |
2089.00 |
1982.02 - 2110.00 |
3.296 times |
Tue 29 July 2025 |
1975.65 (-4.42%) |
2089.00 |
1975.65 - 2089.00 |
0.2499 times |
Mon 30 June 2025 |
2066.99 (2.84%) |
2043.50 |
1950.65 - 2067.99 |
0.8956 times |
Wed 21 May 2025 |
2010.00 (0.75%) |
2040.00 |
1920.00 - 2040.00 |
3.0565 times |
Tue 29 April 2025 |
1995.10 (0.61%) |
2005.55 |
1980.30 - 2030.00 |
0.2109 times |
Tue 25 March 2025 |
1983.00 (0.66%) |
1975.00 |
1950.00 - 1983.00 |
0.0599 times |
Thu 27 February 2025 |
1970.00 (1.31%) |
1932.40 |
1901.25 - 1970.00 |
0.1666 times |
Tue 28 January 2025 |
1944.60 (0.74%) |
1935.45 |
1935.45 - 1944.60 |
0.0391 times |
Fri 27 December 2024 |
1930.41 (4.73%) |
1710.25 |
1700.00 - 1935.45 |
0.716 times |
DMA SMA EMA moving averages of Sec Red SCLZC26_NB
DMA (daily moving average) of Sec Red SCLZC26_NB
| DMA period | DMA value | | 5 day DMA | 2130.09 | | 12 day DMA | 2106.7 | | 20 day DMA | 2104.44 | | 35 day DMA | 2093.59 | | 50 day DMA | 2079.95 | | 100 day DMA | | | 150 day DMA | | | 200 day DMA | | EMA (exponential moving average) of Sec Red SCLZC26_NB
| EMA period | EMA current | EMA prev | EMA prev2 | | 5 day EMA | 2128.18 | 2123 | 2118.38 | | 12 day EMA | 2114.55 | 2110.19 | 2106.18 | | 20 day EMA | 2105.77 | 2102.32 | 2099.17 | | 35 day EMA | 2091.44 | 2088.67 | 2086.11 | | 50 day EMA | 2079.72 | 2077.32 | 2075.08 |
SMA (simple moving average) of Sec Red SCLZC26_NB
| SMA period | SMA current | SMA prev | SMA prev2 | | 5 day SMA | 2130.09 | 2127.49 | 2119.04 | | 12 day SMA | 2106.7 | 2099.6 | 2097.08 | | 20 day SMA | 2104.44 | 2103.02 | 2098.42 | | 35 day SMA | 2093.59 | 2088.94 | 2087.56 | | 50 day SMA | 2079.95 | 2078.05 | 2075.61 | | 100 day SMA | | 150 day SMA | | 200 day SMA |
|
|
