SchneiderElectric SCHNEIDER_BE full analysis,charts,indicators,moving averages,SMA,DMA,EMA,ADX,MACD,RSISchneider Electric SCHNEIDER_BE WideScreen charts, DMA,SMA,EMA technical analysis, forecast prediction, by indicators ADX,MACD,RSI,CCI NSE stock exchange
Daily price and charts and targets SchneiderElectric Strong Daily Stock price targets for SchneiderElectric SCHNEIDER_BE are 837.25 and 873.15 | Daily Target 1 | 829.57 | | Daily Target 2 | 844.93 | | Daily Target 3 | 865.46666666667 | | Daily Target 4 | 880.83 | | Daily Target 5 | 901.37 |
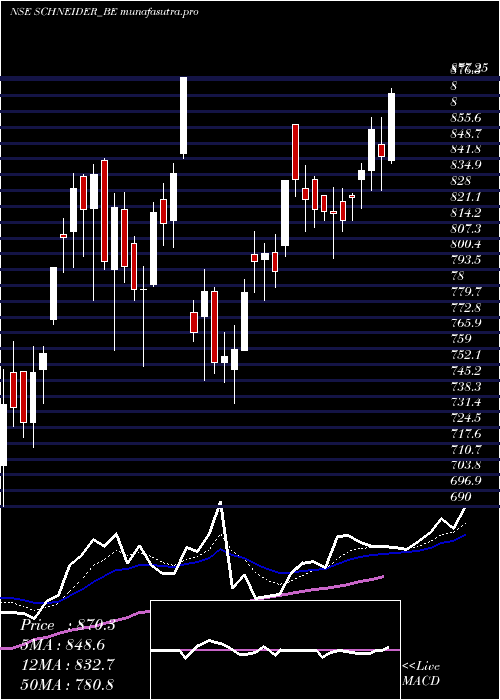
Daily price and volume Schneider Electric
| Date |
Closing |
Open |
Range |
Volume |
Wed 03 September 2025 |
860.30 (-1.81%) |
886.00 |
850.10 - 886.00 |
0.8989 times |
Tue 02 September 2025 |
876.20 (3.77%) |
845.10 |
845.10 - 882.90 |
0.9262 times |
Mon 01 September 2025 |
844.40 (-1.48%) |
859.50 |
837.85 - 865.00 |
0.8335 times |
Fri 29 August 2025 |
857.10 (-0.65%) |
862.70 |
851.00 - 874.80 |
0.9169 times |
Thu 28 August 2025 |
862.70 (0.31%) |
860.00 |
838.00 - 870.00 |
0.9778 times |
Tue 26 August 2025 |
860.00 (0.23%) |
856.00 |
854.00 - 866.80 |
1.1208 times |
Mon 25 August 2025 |
858.00 (-0.29%) |
860.50 |
850.10 - 869.90 |
0.7579 times |
Fri 22 August 2025 |
860.50 (0.03%) |
855.00 |
851.00 - 869.00 |
1.03 times |
Thu 21 August 2025 |
860.20 (2.49%) |
839.30 |
839.30 - 862.40 |
1.1128 times |
Wed 20 August 2025 |
839.30 (-1%) |
846.50 |
833.00 - 869.00 |
1.4253 times |
Tue 19 August 2025 |
847.80 (-2.96%) |
862.40 |
843.10 - 868.50 |
1.1525 times |
Weekly price and charts SchneiderElectric Strong weekly Stock price targets for SchneiderElectric SCHNEIDER_BE are 849.08 and 897.23 | Weekly Target 1 | 813.23 | | Weekly Target 2 | 836.77 | | Weekly Target 3 | 861.38333333333 | | Weekly Target 4 | 884.92 | | Weekly Target 5 | 909.53 |
Weekly price and volumes for Schneider Electric
| Date |
Closing |
Open |
Range |
Volume |
Wed 03 September 2025 |
860.30 (0.37%) |
859.50 |
837.85 - 886.00 |
0.2961 times |
Fri 29 August 2025 |
857.10 (-0.4%) |
860.50 |
838.00 - 874.80 |
0.4203 times |
Fri 22 August 2025 |
860.50 (-1.21%) |
880.00 |
830.00 - 894.00 |
0.7669 times |
Thu 14 August 2025 |
871.00 (-6.82%) |
888.00 |
816.00 - 914.70 |
1.088 times |
Fri 08 August 2025 |
934.70 (-6.65%) |
1000.00 |
934.70 - 1052.00 |
1.2005 times |
Fri 01 August 2025 |
1001.30 (9.65%) |
901.00 |
870.00 - 1050.00 |
1.8459 times |
Fri 25 July 2025 |
913.20 (0.71%) |
915.45 |
886.65 - 943.90 |
1.1143 times |
Fri 18 July 2025 |
906.80 (6.12%) |
848.00 |
828.00 - 916.00 |
1.6402 times |
Fri 11 July 2025 |
854.50 (4.33%) |
819.00 |
798.55 - 860.00 |
0.7245 times |
Fri 04 July 2025 |
819.00 (3.3%) |
803.95 |
799.00 - 857.00 |
0.9033 times |
Fri 27 June 2025 |
792.80 (4.95%) |
750.00 |
735.00 - 810.00 |
1.3083 times |
Monthly price and charts SchneiderElectric Strong monthly Stock price targets for SchneiderElectric SCHNEIDER_BE are 849.08 and 897.23 | Monthly Target 1 | 813.23 | | Monthly Target 2 | 836.77 | | Monthly Target 3 | 861.38333333333 | | Monthly Target 4 | 884.92 | | Monthly Target 5 | 909.53 |
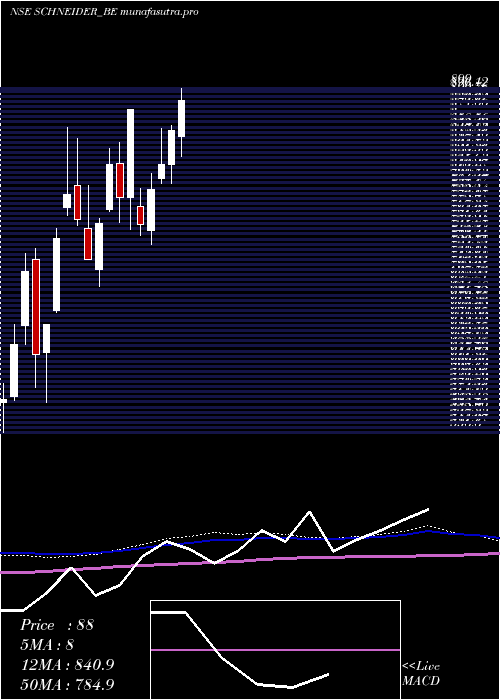
Monthly price and volumes Schneider Electric
| Date |
Closing |
Open |
Range |
Volume |
Wed 03 September 2025 |
860.30 (0.37%) |
859.50 |
837.85 - 886.00 |
0.0763 times |
Fri 29 August 2025 |
857.10 (-14.54%) |
1050.00 |
816.00 - 1052.00 |
1.0182 times |
Thu 31 July 2025 |
1002.90 (20.48%) |
857.00 |
798.55 - 1002.90 |
1.3979 times |
Mon 30 June 2025 |
832.40 (-5.11%) |
774.80 |
735.00 - 832.40 |
0.7278 times |
Fri 17 May 2024 |
877.25 (8.65%) |
810.05 |
751.00 - 877.25 |
0.7549 times |
Tue 30 April 2024 |
807.40 (8.95%) |
774.00 |
690.00 - 857.85 |
1.8661 times |
Thu 28 March 2024 |
741.05 (16.3%) |
645.00 |
568.00 - 752.00 |
1.3489 times |
Thu 29 February 2024 |
637.20 (0%) |
580.00 |
536.60 - 642.00 |
0.8098 times |
Thu 04 September 2025 |
(0%) |
|
- |
0 times |

DMA SMA EMA moving averages of Schneider Electric SCHNEIDER_BE
DMA (daily moving average) of Schneider Electric SCHNEIDER_BE
| DMA period | DMA value | | 5 day DMA | 860.14 | | 12 day DMA | 858.35 | | 20 day DMA | 887.1 | | 35 day DMA | 906.52 | | 50 day DMA | 880.44 | | 100 day DMA | 814.86 | | 150 day DMA | | | 200 day DMA | | EMA (exponential moving average) of Schneider Electric SCHNEIDER_BE
| EMA period | EMA current | EMA prev | EMA prev2 | | 5 day EMA | 861.29 | 861.79 | 854.58 | | 12 day EMA | 867.61 | 868.94 | 867.62 | | 20 day EMA | 876.48 | 878.18 | 878.39 | | 35 day EMA | 870.91 | 871.53 | 871.25 | | 50 day EMA | 868.86 | 869.21 | 868.92 |
SMA (simple moving average) of Schneider Electric SCHNEIDER_BE
| SMA period | SMA current | SMA prev | SMA prev2 | | 5 day SMA | 860.14 | 860.08 | 856.44 | | 12 day SMA | 858.35 | 859.24 | 860.08 | | 20 day SMA | 887.1 | 895.69 | 901.94 | | 35 day SMA | 906.52 | 906.02 | 905.4 | | 50 day SMA | 880.44 | 878.4 | 875.99 | | 100 day SMA | 814.86 | 813.31 | 811.61 | | 150 day SMA | | 200 day SMA |
|
|
