SChand SCHAND full analysis,charts,indicators,moving averages,SMA,DMA,EMA,ADX,MACD,RSIS Chand SCHAND WideScreen charts, DMA,SMA,EMA technical analysis, forecast prediction, by indicators ADX,MACD,RSI,CCI NSE stock exchange
Daily price and charts and targets SChand Strong Daily Stock price targets for SChand SCHAND are 173.88 and 181.87 | Daily Target 1 | 171.93 | | Daily Target 2 | 175.83 | | Daily Target 3 | 179.91666666667 | | Daily Target 4 | 183.82 | | Daily Target 5 | 187.91 |
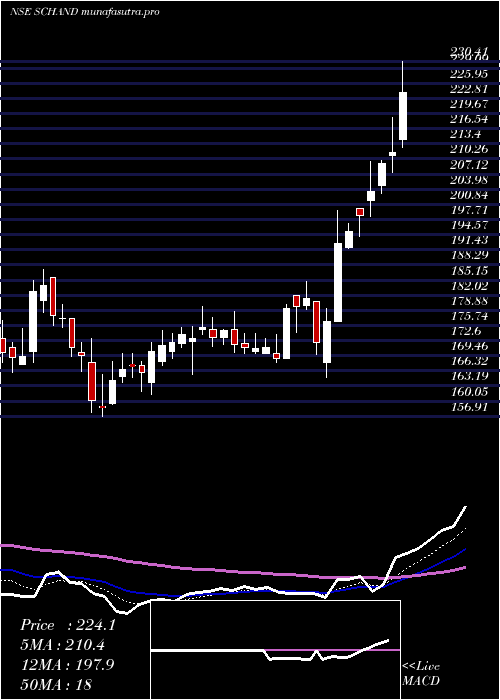
Daily price and volume S Chand
| Date |
Closing |
Open |
Range |
Volume |
Tue 28 October 2025 |
179.74 (0.09%) |
180.00 |
176.01 - 184.00 |
0.4751 times |
Mon 27 October 2025 |
179.58 (-0.41%) |
181.04 |
178.00 - 183.89 |
0.6107 times |
Fri 24 October 2025 |
180.32 (0.26%) |
178.20 |
178.20 - 182.60 |
0.5052 times |
Thu 23 October 2025 |
179.86 (0.74%) |
178.53 |
177.15 - 182.00 |
0.7298 times |
Tue 21 October 2025 |
178.53 (2.57%) |
176.59 |
176.03 - 179.99 |
0.3218 times |
Mon 20 October 2025 |
174.05 (-0.41%) |
174.76 |
172.00 - 178.00 |
0.8107 times |
Fri 17 October 2025 |
174.76 (-1.77%) |
178.00 |
173.11 - 178.74 |
1.2002 times |
Thu 16 October 2025 |
177.90 (0.26%) |
178.40 |
176.21 - 179.50 |
0.6441 times |
Wed 15 October 2025 |
177.43 (0.45%) |
175.13 |
175.00 - 178.59 |
0.4366 times |
Tue 14 October 2025 |
176.63 (-3.6%) |
184.09 |
174.00 - 184.20 |
4.2659 times |
Mon 13 October 2025 |
183.22 (1.81%) |
183.00 |
177.48 - 184.90 |
1.0699 times |
Weekly price and charts SChand Strong weekly Stock price targets for SChand SCHAND are 173.88 and 181.87 | Weekly Target 1 | 171.93 | | Weekly Target 2 | 175.83 | | Weekly Target 3 | 179.91666666667 | | Weekly Target 4 | 183.82 | | Weekly Target 5 | 187.91 |
Weekly price and volumes for S Chand
| Date |
Closing |
Open |
Range |
Volume |
Tue 28 October 2025 |
179.74 (-0.32%) |
181.04 |
176.01 - 184.00 |
0.2619 times |
Fri 24 October 2025 |
180.32 (3.18%) |
174.76 |
172.00 - 182.60 |
0.5711 times |
Fri 17 October 2025 |
174.76 (-2.89%) |
183.00 |
173.11 - 184.90 |
1.8373 times |
Fri 10 October 2025 |
179.96 (-6.23%) |
200.00 |
179.50 - 200.00 |
1.2215 times |
Fri 03 October 2025 |
191.92 (4.21%) |
185.09 |
180.01 - 200.00 |
2.1568 times |
Fri 26 September 2025 |
184.17 (-3.66%) |
194.49 |
181.00 - 194.49 |
0.8212 times |
Fri 19 September 2025 |
191.17 (-0.79%) |
193.70 |
187.50 - 195.90 |
1.1988 times |
Fri 12 September 2025 |
192.70 (-0.91%) |
195.49 |
192.00 - 200.00 |
0.6125 times |
Fri 05 September 2025 |
194.47 (1.05%) |
193.22 |
191.55 - 200.00 |
0.7023 times |
Fri 29 August 2025 |
192.45 (-2.73%) |
197.85 |
190.00 - 198.90 |
0.6167 times |
Fri 22 August 2025 |
197.85 (1.86%) |
195.30 |
193.03 - 200.87 |
0.8017 times |

Monthly price and charts SChand Strong monthly Stock price targets for SChand SCHAND are 161.87 and 189.87 | Monthly Target 1 | 155.91 | | Monthly Target 2 | 167.83 | | Monthly Target 3 | 183.91333333333 | | Monthly Target 4 | 195.83 | | Monthly Target 5 | 211.91 |
Monthly price and volumes S Chand
| Date |
Closing |
Open |
Range |
Volume |
Tue 28 October 2025 |
179.74 (-4.31%) |
191.59 |
172.00 - 200.00 |
0.5303 times |
Tue 30 September 2025 |
187.83 (-2.4%) |
193.22 |
180.01 - 200.00 |
0.6299 times |
Fri 29 August 2025 |
192.45 (-14.61%) |
226.99 |
182.21 - 226.99 |
0.5575 times |
Thu 31 July 2025 |
225.37 (-3.51%) |
232.70 |
213.52 - 238.38 |
0.5655 times |
Mon 30 June 2025 |
233.57 (10.39%) |
210.08 |
207.02 - 257.90 |
2.2358 times |
Fri 30 May 2025 |
211.58 (6.63%) |
198.40 |
181.99 - 242.00 |
1.5979 times |
Wed 30 April 2025 |
198.43 (17.49%) |
168.89 |
165.00 - 230.41 |
1.6868 times |
Fri 28 March 2025 |
168.89 (-0.37%) |
168.00 |
156.91 - 179.60 |
1.0576 times |
Fri 28 February 2025 |
169.51 (-11.35%) |
191.99 |
166.08 - 193.41 |
0.6405 times |
Fri 31 January 2025 |
191.22 (-10%) |
212.50 |
185.60 - 221.65 |
0.4982 times |
Tue 31 December 2024 |
212.46 (-1.92%) |
216.60 |
206.63 - 239.39 |
0.7794 times |

DMA SMA EMA moving averages of S Chand SCHAND
DMA (daily moving average) of S Chand SCHAND
| DMA period | DMA value | | 5 day DMA | 179.61 | | 12 day DMA | 178.5 | | 20 day DMA | 181.87 | | 35 day DMA | 185.91 | | 50 day DMA | 188.78 | | 100 day DMA | 206.14 | | 150 day DMA | 205.08 | | 200 day DMA | 200.4 | EMA (exponential moving average) of S Chand SCHAND
| EMA period | EMA current | EMA prev | EMA prev2 | | 5 day EMA | 179.3 | 179.08 | 178.83 | | 12 day EMA | 179.88 | 179.9 | 179.96 | | 20 day EMA | 181.62 | 181.82 | 182.06 | | 35 day EMA | 184.94 | 185.25 | 185.58 | | 50 day EMA | 188.47 | 188.83 | 189.21 |
SMA (simple moving average) of S Chand SCHAND
| SMA period | SMA current | SMA prev | SMA prev2 | | 5 day SMA | 179.61 | 178.47 | 177.5 | | 12 day SMA | 178.5 | 178.69 | 179.24 | | 20 day SMA | 181.87 | 182.09 | 182.33 | | 35 day SMA | 185.91 | 186.33 | 186.87 | | 50 day SMA | 188.78 | 189.09 | 189.32 | | 100 day SMA | 206.14 | 206.43 | 206.75 | | 150 day SMA | 205.08 | 205.06 | 205.01 | | 200 day SMA | 200.4 | 200.55 | 200.74 |
|
|
