SbiamcSbineqwetf SBINEQWETF full analysis,charts,indicators,moving averages,SMA,DMA,EMA,ADX,MACD,RSISbiamc Sbineqwetf SBINEQWETF WideScreen charts, DMA,SMA,EMA technical analysis, forecast prediction, by indicators ADX,MACD,RSI,CCI NSE stock exchange
Daily price and charts and targets SbiamcSbineqwetf Strong Daily Stock price targets for SbiamcSbineqwetf SBINEQWETF are 33.2 and 33.56 | Daily Target 1 | 33.12 | | Daily Target 2 | 33.28 | | Daily Target 3 | 33.476666666667 | | Daily Target 4 | 33.64 | | Daily Target 5 | 33.84 |
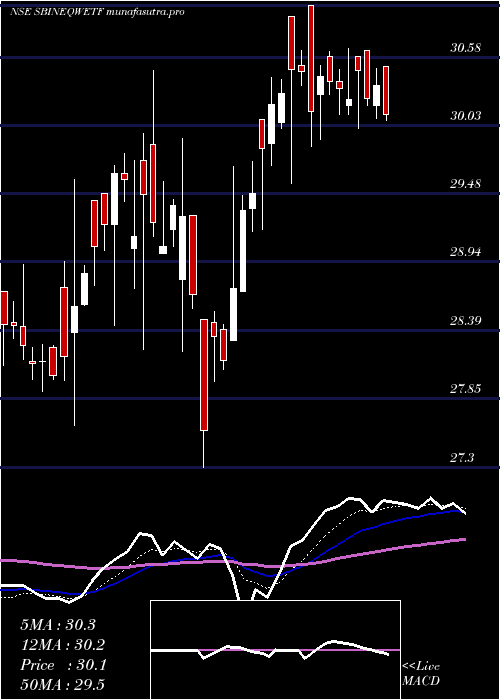
Daily price and volume Sbiamc Sbineqwetf
| Date |
Closing |
Open |
Range |
Volume |
Tue 28 October 2025 |
33.45 (-0.18%) |
33.67 |
33.31 - 33.67 |
0.792 times |
Mon 27 October 2025 |
33.51 (1.09%) |
33.31 |
33.00 - 33.60 |
0.6688 times |
Fri 24 October 2025 |
33.15 (-0.63%) |
33.52 |
33.02 - 33.54 |
0.6245 times |
Thu 23 October 2025 |
33.36 (0%) |
33.79 |
33.29 - 34.41 |
0.9044 times |
Tue 21 October 2025 |
33.36 (0%) |
33.53 |
33.27 - 33.78 |
0.6939 times |
Mon 20 October 2025 |
33.36 (0.97%) |
33.21 |
33.06 - 33.43 |
0.9205 times |
Fri 17 October 2025 |
33.04 (0.12%) |
33.28 |
32.64 - 33.32 |
0.9365 times |
Thu 16 October 2025 |
33.00 (1.01%) |
32.33 |
32.05 - 33.05 |
2.3406 times |
Wed 15 October 2025 |
32.67 (0.71%) |
32.87 |
32.21 - 32.87 |
0.5787 times |
Tue 14 October 2025 |
32.44 (-0.22%) |
31.69 |
31.43 - 32.88 |
1.5401 times |
Mon 13 October 2025 |
32.51 (-0.31%) |
32.91 |
31.97 - 32.92 |
0.6454 times |
Weekly price and charts SbiamcSbineqwetf Strong weekly Stock price targets for SbiamcSbineqwetf SBINEQWETF are 33.23 and 33.9 | Weekly Target 1 | 32.7 | | Weekly Target 2 | 33.08 | | Weekly Target 3 | 33.373333333333 | | Weekly Target 4 | 33.75 | | Weekly Target 5 | 34.04 |
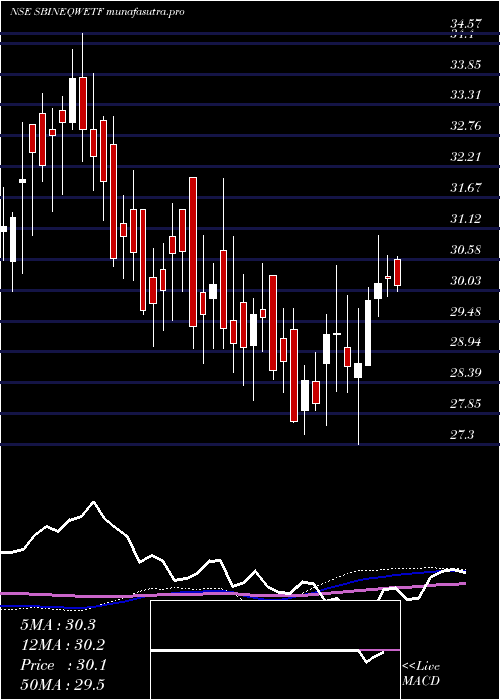
Weekly price and volumes for Sbiamc Sbineqwetf
| Date |
Closing |
Open |
Range |
Volume |
Tue 28 October 2025 |
33.45 (0.9%) |
33.31 |
33.00 - 33.67 |
0.446 times |
Fri 24 October 2025 |
33.15 (0.33%) |
33.21 |
33.02 - 34.41 |
0.9598 times |
Fri 17 October 2025 |
33.04 (1.32%) |
32.91 |
31.43 - 33.32 |
1.8447 times |
Fri 10 October 2025 |
32.61 (1.05%) |
32.43 |
32.05 - 32.76 |
1.8395 times |
Fri 03 October 2025 |
32.27 (1.41%) |
32.06 |
31.37 - 32.77 |
0.4829 times |
Fri 26 September 2025 |
31.82 (-2.63%) |
32.95 |
31.64 - 33.00 |
0.7809 times |
Fri 19 September 2025 |
32.68 (0.96%) |
32.63 |
32.01 - 32.99 |
0.6972 times |
Fri 12 September 2025 |
32.37 (1.35%) |
32.09 |
31.30 - 32.75 |
1.1619 times |
Fri 05 September 2025 |
31.94 (1.62%) |
31.43 |
30.90 - 32.35 |
0.7141 times |
Fri 29 August 2025 |
31.43 (-1.19%) |
31.96 |
31.35 - 32.24 |
1.0731 times |
Fri 22 August 2025 |
31.81 (1.53%) |
31.49 |
31.48 - 32.23 |
0.7181 times |
Monthly price and charts SbiamcSbineqwetf Strong monthly Stock price targets for SbiamcSbineqwetf SBINEQWETF are 32.44 and 35.42 | Monthly Target 1 | 30.12 | | Monthly Target 2 | 31.78 | | Monthly Target 3 | 33.096666666667 | | Monthly Target 4 | 34.76 | | Monthly Target 5 | 36.08 |
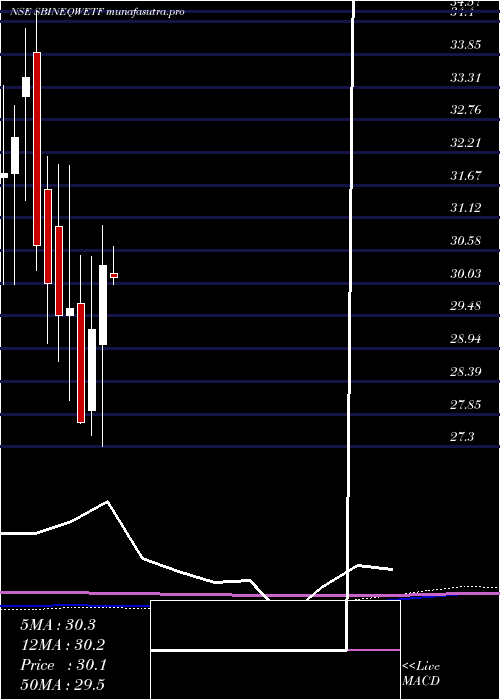
Monthly price and volumes Sbiamc Sbineqwetf
| Date |
Closing |
Open |
Range |
Volume |
Tue 28 October 2025 |
33.45 (4.86%) |
31.90 |
31.43 - 34.41 |
0.8654 times |
Tue 30 September 2025 |
31.90 (1.5%) |
31.43 |
30.90 - 33.00 |
0.5768 times |
Fri 29 August 2025 |
31.43 (0.58%) |
31.40 |
30.21 - 32.24 |
0.4861 times |
Thu 31 July 2025 |
31.25 (-3.1%) |
32.25 |
30.67 - 32.68 |
0.61 times |
Mon 30 June 2025 |
32.25 (3.7%) |
31.19 |
30.03 - 32.58 |
1.0706 times |
Fri 30 May 2025 |
31.10 (2.54%) |
30.19 |
29.55 - 32.50 |
0.8752 times |
Wed 30 April 2025 |
30.33 (3.66%) |
29.01 |
27.30 - 30.99 |
1.2183 times |
Fri 28 March 2025 |
29.26 (5.59%) |
27.90 |
27.48 - 30.47 |
1.6013 times |
Fri 28 February 2025 |
27.71 (-6.39%) |
29.69 |
27.69 - 30.50 |
1.6717 times |
Fri 31 January 2025 |
29.60 (0.37%) |
29.50 |
28.07 - 32.00 |
1.0244 times |
Tue 31 December 2024 |
29.49 (-1.77%) |
30.97 |
28.73 - 32.02 |
1.1829 times |
DMA SMA EMA moving averages of Sbiamc Sbineqwetf SBINEQWETF
DMA (daily moving average) of Sbiamc Sbineqwetf SBINEQWETF
| DMA period | DMA value | | 5 day DMA | 33.37 | | 12 day DMA | 33.04 | | 20 day DMA | 32.71 | | 35 day DMA | 32.58 | | 50 day DMA | 32.34 | | 100 day DMA | 31.96 | | 150 day DMA | 31.35 | | 200 day DMA | 30.72 | EMA (exponential moving average) of Sbiamc Sbineqwetf SBINEQWETF
| EMA period | EMA current | EMA prev | EMA prev2 | | 5 day EMA | 33.34 | 33.29 | 33.18 | | 12 day EMA | 33.09 | 33.02 | 32.93 | | 20 day EMA | 32.87 | 32.81 | 32.74 | | 35 day EMA | 32.59 | 32.54 | 32.48 | | 50 day EMA | 32.35 | 32.31 | 32.26 |
SMA (simple moving average) of Sbiamc Sbineqwetf SBINEQWETF
| SMA period | SMA current | SMA prev | SMA prev2 | | 5 day SMA | 33.37 | 33.35 | 33.25 | | 12 day SMA | 33.04 | 32.96 | 32.86 | | 20 day SMA | 32.71 | 32.63 | 32.57 | | 35 day SMA | 32.58 | 32.54 | 32.49 | | 50 day SMA | 32.34 | 32.3 | 32.25 | | 100 day SMA | 31.96 | 31.94 | 31.91 | | 150 day SMA | 31.35 | 31.32 | 31.29 | | 200 day SMA | 30.72 | 30.7 | 30.68 |
|
|
