SbiamcSbiliqetf SBILIQETF full analysis,charts,indicators,moving averages,SMA,DMA,EMA,ADX,MACD,RSISbiamc Sbiliqetf SBILIQETF WideScreen charts, DMA,SMA,EMA technical analysis, forecast prediction, by indicators ADX,MACD,RSI,CCI NSE stock exchange
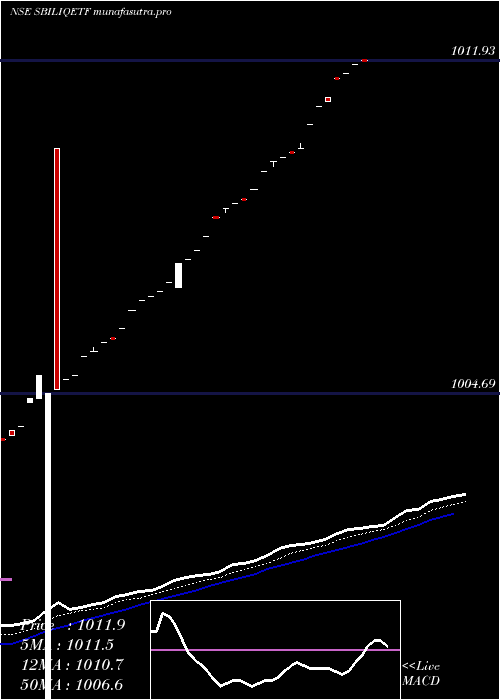
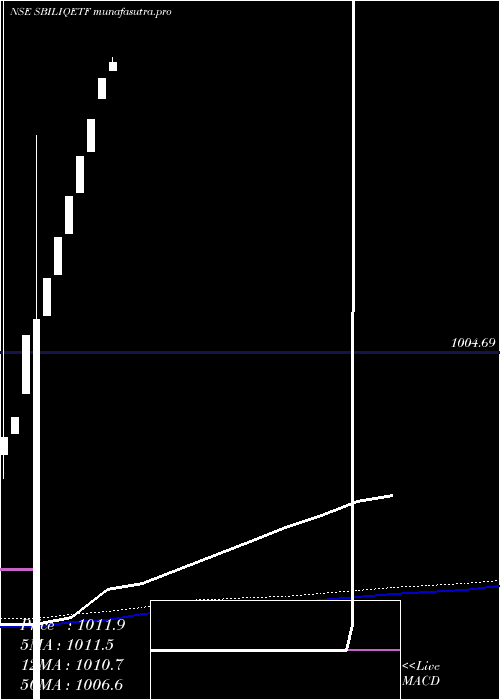
Daily price and charts and targets SbiamcSbiliqetf Strong Daily Stock price targets for SbiamcSbiliqetf SBILIQETF are 1011.9 and 1011.92 | Daily Target 1 | 1011.9 | | Daily Target 2 | 1011.9 | | Daily Target 3 | 1011.9166666667 | | Daily Target 4 | 1011.92 | | Daily Target 5 | 1011.94 |
Daily price and volume Sbiamc Sbiliqetf
| Date |
Closing |
Open |
Range |
Volume |
Wed 29 October 2025 |
1011.91 (0.01%) |
1011.93 |
1011.91 - 1011.93 |
1.2005 times |
Tue 28 October 2025 |
1011.77 (0.01%) |
1011.77 |
1011.77 - 1011.79 |
2.0438 times |
Mon 27 October 2025 |
1011.62 (0.01%) |
1011.62 |
1011.62 - 1011.64 |
2.4752 times |
Fri 24 October 2025 |
1011.48 (0.04%) |
1011.49 |
1011.48 - 1011.50 |
0.3218 times |
Thu 23 October 2025 |
1011.05 (0.01%) |
1011.07 |
1011.05 - 1011.07 |
0.0808 times |
Mon 20 October 2025 |
1010.93 (0.05%) |
1010.91 |
1010.91 - 1010.93 |
1.357 times |
Fri 17 October 2025 |
1010.47 (0.04%) |
1010.46 |
1010.46 - 1010.48 |
1.9006 times |
Thu 16 October 2025 |
1010.04 (0.01%) |
1010.04 |
1010.04 - 1010.06 |
0.1256 times |
Wed 15 October 2025 |
1009.92 (0.01%) |
1009.93 |
1009.91 - 1009.93 |
0.1699 times |
Tue 14 October 2025 |
1009.77 (0.01%) |
1009.77 |
1009.77 - 1009.77 |
0.3248 times |
Mon 13 October 2025 |
1009.65 (0.01%) |
1009.65 |
1009.63 - 1009.65 |
13.7483 times |
Weekly price and charts SbiamcSbiliqetf Strong weekly Stock price targets for SbiamcSbiliqetf SBILIQETF are 1011.77 and 1012.08 | Weekly Target 1 | 1011.51 | | Weekly Target 2 | 1011.71 | | Weekly Target 3 | 1011.82 | | Weekly Target 4 | 1012.02 | | Weekly Target 5 | 1012.13 |
Weekly price and volumes for Sbiamc Sbiliqetf
| Date |
Closing |
Open |
Range |
Volume |
Wed 29 October 2025 |
1011.91 (0.04%) |
1011.62 |
1011.62 - 1011.93 |
0.2075 times |
Fri 24 October 2025 |
1011.48 (0.1%) |
1010.91 |
1010.91 - 1011.50 |
0.0639 times |
Fri 17 October 2025 |
1010.47 (0.1%) |
1009.65 |
1009.63 - 1010.48 |
0.5904 times |
Fri 10 October 2025 |
1009.50 (0.1%) |
1008.66 |
1008.64 - 1009.50 |
2.7586 times |
Fri 03 October 2025 |
1008.50 (0.1%) |
1007.61 |
1007.61 - 1008.52 |
1.0405 times |
Fri 26 September 2025 |
1007.50 (0.1%) |
1006.63 |
1006.63 - 1007.50 |
0.4771 times |
Fri 19 September 2025 |
1006.49 (0.1%) |
1005.61 |
1005.61 - 1006.49 |
4.725 times |
Fri 12 September 2025 |
1005.49 (0.04%) |
984.99 |
984.99 - 1010.00 |
0.0223 times |
Fri 05 September 2025 |
1005.09 (0.2%) |
1003.68 |
1003.66 - 1005.11 |
0.0655 times |
Thu 28 August 2025 |
1003.10 (0.05%) |
1002.67 |
1002.67 - 1003.11 |
0.0494 times |
Fri 22 August 2025 |
1002.55 (0%) |
1002.20 |
1001.57 - 1027.15 |
1.8757 times |
Monthly price and charts SbiamcSbiliqetf Strong monthly Stock price targets for SbiamcSbiliqetf SBILIQETF are 1009.98 and 1013.86 | Monthly Target 1 | 1006.75 | | Monthly Target 2 | 1009.33 | | Monthly Target 3 | 1010.63 | | Monthly Target 4 | 1013.21 | | Monthly Target 5 | 1014.51 |
Monthly price and volumes Sbiamc Sbiliqetf
| Date |
Closing |
Open |
Range |
Volume |
Wed 29 October 2025 |
1011.91 (0.41%) |
1008.05 |
1008.05 - 1011.93 |
1.166 times |
Tue 30 September 2025 |
1007.78 (0.47%) |
1003.68 |
984.99 - 1010.00 |
1.3472 times |
Thu 28 August 2025 |
1003.10 (0%) |
1010.00 |
1000.84 - 1027.15 |
0.4868 times |
Wed 29 October 2025 |
(0%) |
|
- |
0 times |

DMA SMA EMA moving averages of Sbiamc Sbiliqetf SBILIQETF
DMA (daily moving average) of Sbiamc Sbiliqetf SBILIQETF
| DMA period | DMA value | | 5 day DMA | 1011.57 | | 12 day DMA | 1010.68 | | 20 day DMA | 1009.78 | | 35 day DMA | 1008.14 | | 50 day DMA | | | 100 day DMA | | | 150 day DMA | | | 200 day DMA | | EMA (exponential moving average) of Sbiamc Sbiliqetf SBILIQETF
| EMA period | EMA current | EMA prev | EMA prev2 | | 5 day EMA | 1011.52 | 1011.33 | 1011.11 | | 12 day EMA | 1010.71 | 1010.49 | 1010.26 | | 20 day EMA | 1009.82 | 1009.6 | 1009.37 | | 35 day EMA | 1008.18 | 1007.96 | 1007.74 | | 50 day EMA | 1006.55 |
SMA (simple moving average) of Sbiamc Sbiliqetf SBILIQETF
| SMA period | SMA current | SMA prev | SMA prev2 | | 5 day SMA | 1011.57 | 1011.37 | 1011.11 | | 12 day SMA | 1010.68 | 1010.44 | 1010.2 | | 20 day SMA | 1009.78 | 1009.55 | 1009.32 | | 35 day SMA | 1008.14 | 1007.95 | 1007.74 | | 50 day SMA | | 100 day SMA | | 150 day SMA | | 200 day SMA |
|
|
