SbiamcSbietfqlty SBIETFQLTY full analysis,charts,indicators,moving averages,SMA,DMA,EMA,ADX,MACD,RSISbiamc Sbietfqlty SBIETFQLTY WideScreen charts, DMA,SMA,EMA technical analysis, forecast prediction, by indicators ADX,MACD,RSI,CCI NSE stock exchange
Daily price and charts and targets SbiamcSbietfqlty Strong Daily Stock price targets for SbiamcSbietfqlty SBIETFQLTY are 226.41 and 228.88 | Daily Target 1 | 225.81 | | Daily Target 2 | 227 | | Daily Target 3 | 228.28333333333 | | Daily Target 4 | 229.47 | | Daily Target 5 | 230.75 |
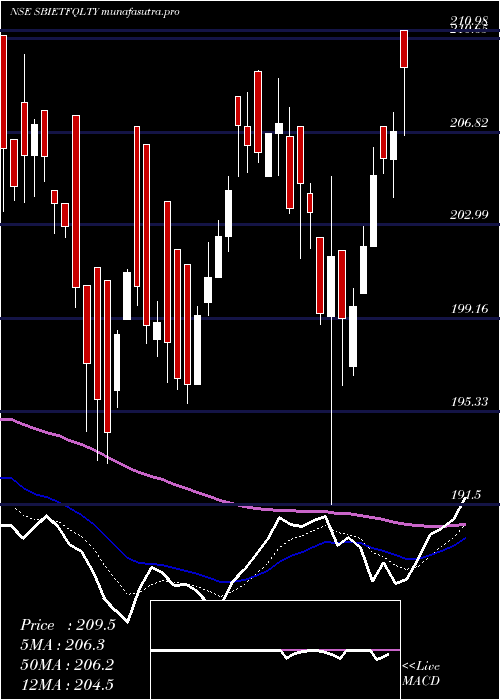
Daily price and volume Sbiamc Sbietfqlty
| Date |
Closing |
Open |
Range |
Volume |
Tue 28 October 2025 |
228.18 (-0.6%) |
229.50 |
227.10 - 229.57 |
0.2472 times |
Mon 27 October 2025 |
229.56 (0.25%) |
225.17 |
225.17 - 232.98 |
0.3269 times |
Fri 24 October 2025 |
228.98 (-0.5%) |
229.56 |
228.05 - 229.58 |
1.0286 times |
Thu 23 October 2025 |
230.13 (0.75%) |
230.14 |
229.56 - 231.16 |
0.2529 times |
Tue 21 October 2025 |
228.42 (0.13%) |
229.08 |
228.11 - 229.10 |
0.0717 times |
Mon 20 October 2025 |
228.12 (-0.21%) |
234.39 |
225.16 - 234.39 |
1.5365 times |
Fri 17 October 2025 |
228.60 (0.67%) |
228.13 |
227.16 - 229.26 |
0.4777 times |
Thu 16 October 2025 |
227.08 (0.84%) |
225.60 |
225.40 - 228.21 |
0.8306 times |
Wed 15 October 2025 |
225.19 (0.85%) |
222.19 |
222.19 - 225.58 |
3.3583 times |
Tue 14 October 2025 |
223.30 (-0.57%) |
224.58 |
222.96 - 225.83 |
1.8695 times |
Mon 13 October 2025 |
224.58 (-0.39%) |
228.38 |
222.09 - 228.39 |
3.3319 times |
Weekly price and charts SbiamcSbietfqlty Strong weekly Stock price targets for SbiamcSbietfqlty SBIETFQLTY are 226.68 and 234.49 | Weekly Target 1 | 220.97 | | Weekly Target 2 | 224.57 | | Weekly Target 3 | 228.77666666667 | | Weekly Target 4 | 232.38 | | Weekly Target 5 | 236.59 |
Weekly price and volumes for Sbiamc Sbietfqlty
| Date |
Closing |
Open |
Range |
Volume |
Tue 28 October 2025 |
228.18 (-0.35%) |
225.17 |
225.17 - 232.98 |
0.0727 times |
Fri 24 October 2025 |
228.98 (0.17%) |
234.39 |
225.16 - 234.39 |
0.3657 times |
Fri 17 October 2025 |
228.60 (1.39%) |
228.38 |
222.09 - 229.26 |
1.249 times |
Fri 10 October 2025 |
225.46 (1.33%) |
229.16 |
221.66 - 229.16 |
0.3799 times |
Fri 03 October 2025 |
222.49 (1.21%) |
216.66 |
216.66 - 224.30 |
6.5575 times |
Fri 26 September 2025 |
219.84 (-3.94%) |
229.99 |
219.25 - 229.99 |
0.2498 times |
Fri 19 September 2025 |
228.85 (0.79%) |
229.88 |
223.66 - 235.22 |
0.2669 times |
Fri 12 September 2025 |
227.05 (1.2%) |
231.08 |
222.05 - 234.35 |
0.2761 times |
Fri 05 September 2025 |
224.35 (1.81%) |
219.25 |
219.25 - 227.37 |
0.389 times |
Fri 29 August 2025 |
220.36 (-0.57%) |
226.40 |
219.28 - 229.08 |
0.1934 times |
Fri 22 August 2025 |
221.63 (1.9%) |
210.98 |
210.98 - 224.64 |
0.2594 times |

Monthly price and charts SbiamcSbietfqlty Strong monthly Stock price targets for SbiamcSbietfqlty SBIETFQLTY are 223.62 and 238.95 | Monthly Target 1 | 211.88 | | Monthly Target 2 | 220.03 | | Monthly Target 3 | 227.21 | | Monthly Target 4 | 235.36 | | Monthly Target 5 | 242.54 |
Monthly price and volumes Sbiamc Sbietfqlty
| Date |
Closing |
Open |
Range |
Volume |
Tue 28 October 2025 |
228.18 (3.46%) |
221.21 |
219.06 - 234.39 |
0.3619 times |
Tue 30 September 2025 |
220.54 (0.08%) |
219.25 |
216.66 - 235.22 |
0.7174 times |
Fri 29 August 2025 |
220.36 (0.99%) |
219.28 |
210.98 - 229.08 |
0.2265 times |
Thu 31 July 2025 |
218.19 (-3.72%) |
227.75 |
215.45 - 234.09 |
2.0515 times |
Mon 30 June 2025 |
226.62 (2.48%) |
227.76 |
217.02 - 227.76 |
2.7144 times |
Fri 30 May 2025 |
221.13 (4.02%) |
213.10 |
207.27 - 223.75 |
2.1958 times |
Wed 30 April 2025 |
212.58 (2.62%) |
206.63 |
191.50 - 225.68 |
0.3386 times |
Fri 28 March 2025 |
207.16 (5%) |
201.25 |
193.19 - 209.34 |
0.2354 times |
Fri 28 February 2025 |
197.29 (-9.84%) |
219.28 |
194.51 - 228.22 |
0.8119 times |
Fri 31 January 2025 |
218.83 (-1.79%) |
228.70 |
210.00 - 231.00 |
0.3466 times |
Tue 31 December 2024 |
222.81 (-2.26%) |
227.97 |
220.18 - 237.63 |
0.2545 times |

DMA SMA EMA moving averages of Sbiamc Sbietfqlty SBIETFQLTY
DMA (daily moving average) of Sbiamc Sbietfqlty SBIETFQLTY
| DMA period | DMA value | | 5 day DMA | 229.05 | | 12 day DMA | 227.3 | | 20 day DMA | 225.33 | | 35 day DMA | 225.75 | | 50 day DMA | 224.78 | | 100 day DMA | 223.68 | | 150 day DMA | 219.88 | | 200 day DMA | 217.27 | EMA (exponential moving average) of Sbiamc Sbietfqlty SBIETFQLTY
| EMA period | EMA current | EMA prev | EMA prev2 | | 5 day EMA | 228.65 | 228.89 | 228.55 | | 12 day EMA | 227.52 | 227.4 | 227.01 | | 20 day EMA | 226.58 | 226.41 | 226.08 | | 35 day EMA | 225.37 | 225.2 | 224.94 | | 50 day EMA | 224.63 | 224.48 | 224.27 |
SMA (simple moving average) of Sbiamc Sbietfqlty SBIETFQLTY
| SMA period | SMA current | SMA prev | SMA prev2 | | 5 day SMA | 229.05 | 229.04 | 228.85 | | 12 day SMA | 227.3 | 226.99 | 226.48 | | 20 day SMA | 225.33 | 224.91 | 224.62 | | 35 day SMA | 225.75 | 225.64 | 225.51 | | 50 day SMA | 224.78 | 224.57 | 224.32 | | 100 day SMA | 223.68 | 223.6 | 223.51 | | 150 day SMA | 219.88 | 219.7 | 219.5 | | 200 day SMA | 217.27 | 217.28 | 217.26 |
|
|
