SbfcFinance SBFC full analysis,charts,indicators,moving averages,SMA,DMA,EMA,ADX,MACD,RSISbfc Finance SBFC WideScreen charts, DMA,SMA,EMA technical analysis, forecast prediction, by indicators ADX,MACD,RSI,CCI NSE stock exchange
Daily price and charts and targets SbfcFinance Strong Daily Stock price targets for SbfcFinance SBFC are 104.98 and 107.28 | Daily Target 1 | 103.28 | | Daily Target 2 | 104.37 | | Daily Target 3 | 105.58333333333 | | Daily Target 4 | 106.67 | | Daily Target 5 | 107.88 |
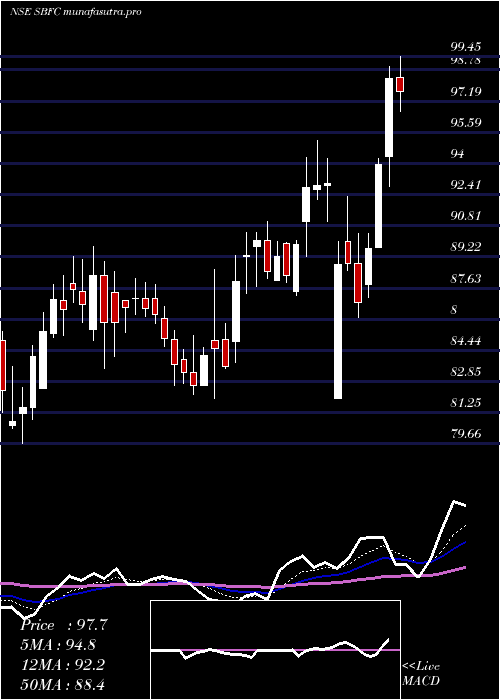
Daily price and volume Sbfc Finance
| Date |
Closing |
Open |
Range |
Volume |
Wed 10 December 2025 |
105.45 (0.41%) |
104.64 |
104.50 - 106.80 |
0.4935 times |
Tue 09 December 2025 |
105.02 (0.36%) |
103.71 |
103.20 - 105.59 |
0.9552 times |
Mon 08 December 2025 |
104.64 (-1.53%) |
106.27 |
103.67 - 106.57 |
1.8962 times |
Fri 05 December 2025 |
106.27 (0.33%) |
105.90 |
104.17 - 106.88 |
0.8641 times |
Thu 04 December 2025 |
105.92 (-0.21%) |
106.14 |
105.56 - 106.65 |
0.4314 times |
Wed 03 December 2025 |
106.14 (-0.1%) |
106.85 |
105.30 - 106.90 |
0.8272 times |
Tue 02 December 2025 |
106.25 (-1.34%) |
107.60 |
105.90 - 107.66 |
0.6896 times |
Mon 01 December 2025 |
107.69 (-0.64%) |
107.61 |
107.01 - 108.69 |
0.7515 times |
Fri 28 November 2025 |
108.38 (1.71%) |
106.66 |
106.39 - 108.64 |
1.4069 times |
Thu 27 November 2025 |
106.56 (-2.13%) |
109.09 |
105.59 - 109.58 |
1.6847 times |
Wed 26 November 2025 |
108.88 (1.43%) |
107.70 |
107.08 - 109.00 |
0.6443 times |
Weekly price and charts SbfcFinance Strong weekly Stock price targets for SbfcFinance SBFC are 102.53 and 106.13 | Weekly Target 1 | 101.55 | | Weekly Target 2 | 103.5 | | Weekly Target 3 | 105.15 | | Weekly Target 4 | 107.1 | | Weekly Target 5 | 108.75 |
Weekly price and volumes for Sbfc Finance
| Date |
Closing |
Open |
Range |
Volume |
Wed 10 December 2025 |
105.45 (-0.77%) |
106.27 |
103.20 - 106.80 |
0.2885 times |
Fri 05 December 2025 |
106.27 (-1.95%) |
107.61 |
104.17 - 108.69 |
0.3074 times |
Fri 28 November 2025 |
108.38 (0.8%) |
107.52 |
104.67 - 109.58 |
0.5915 times |
Fri 21 November 2025 |
107.52 (-1.63%) |
109.10 |
107.17 - 114.28 |
0.797 times |
Fri 14 November 2025 |
109.30 (-4.1%) |
113.20 |
108.00 - 114.37 |
0.6846 times |
Fri 07 November 2025 |
113.97 (-0.1%) |
117.00 |
111.02 - 123.00 |
3.4002 times |
Fri 31 October 2025 |
114.08 (-1.21%) |
116.01 |
112.48 - 116.70 |
0.6064 times |
Fri 24 October 2025 |
115.48 (2.35%) |
112.80 |
109.92 - 117.75 |
1.5688 times |
Fri 17 October 2025 |
112.83 (3.74%) |
107.01 |
105.25 - 113.95 |
1.0192 times |
Fri 10 October 2025 |
108.76 (0.36%) |
110.00 |
107.71 - 113.50 |
0.7365 times |
Fri 03 October 2025 |
108.37 (1.69%) |
106.95 |
105.48 - 109.98 |
0.552 times |

Monthly price and charts SbfcFinance Strong monthly Stock price targets for SbfcFinance SBFC are 101.58 and 107.07 | Monthly Target 1 | 100.29 | | Monthly Target 2 | 102.87 | | Monthly Target 3 | 105.78 | | Monthly Target 4 | 108.36 | | Monthly Target 5 | 111.27 |
Monthly price and volumes Sbfc Finance
| Date |
Closing |
Open |
Range |
Volume |
Wed 10 December 2025 |
105.45 (-2.7%) |
107.61 |
103.20 - 108.69 |
0.1203 times |
Fri 28 November 2025 |
108.38 (-5%) |
117.00 |
104.67 - 123.00 |
1.1051 times |
Fri 31 October 2025 |
114.08 (7.63%) |
106.06 |
105.25 - 117.75 |
0.8505 times |
Tue 30 September 2025 |
105.99 (0.37%) |
105.60 |
103.21 - 113.40 |
0.7721 times |
Fri 29 August 2025 |
105.60 (0.84%) |
104.73 |
100.61 - 116.35 |
0.6636 times |
Thu 31 July 2025 |
104.72 (-6.61%) |
113.69 |
104.01 - 120.50 |
1.207 times |
Mon 30 June 2025 |
112.13 (-0.7%) |
112.37 |
102.00 - 117.00 |
1.2149 times |
Fri 30 May 2025 |
112.92 (10.44%) |
101.00 |
93.00 - 115.00 |
1.3297 times |
Wed 30 April 2025 |
102.25 (15.88%) |
87.46 |
82.00 - 109.90 |
1.3866 times |
Fri 28 March 2025 |
88.24 (-0.03%) |
88.27 |
82.00 - 91.00 |
1.3502 times |
Fri 28 February 2025 |
88.27 (3.54%) |
85.88 |
79.24 - 89.73 |
0.5944 times |

DMA SMA EMA moving averages of Sbfc Finance SBFC
DMA (daily moving average) of Sbfc Finance SBFC
| DMA period | DMA value | | 5 day DMA | 105.46 | | 12 day DMA | 106.55 | | 20 day DMA | 107.39 | | 35 day DMA | 110.22 | | 50 day DMA | 109.76 | | 100 day DMA | 108.96 | | 150 day DMA | 109.05 | | 200 day DMA | 104.63 | EMA (exponential moving average) of Sbfc Finance SBFC
| EMA period | EMA current | EMA prev | EMA prev2 | | 5 day EMA | 105.54 | 105.58 | 105.86 | | 12 day EMA | 106.45 | 106.63 | 106.92 | | 20 day EMA | 107.41 | 107.62 | 107.89 | | 35 day EMA | 108.26 | 108.43 | 108.63 | | 50 day EMA | 109.32 | 109.48 | 109.66 |
SMA (simple moving average) of Sbfc Finance SBFC
| SMA period | SMA current | SMA prev | SMA prev2 | | 5 day SMA | 105.46 | 105.6 | 105.84 | | 12 day SMA | 106.55 | 106.53 | 106.74 | | 20 day SMA | 107.39 | 107.61 | 107.88 | | 35 day SMA | 110.22 | 110.38 | 110.6 | | 50 day SMA | 109.76 | 109.79 | 109.86 | | 100 day SMA | 108.96 | 109.08 | 109.21 | | 150 day SMA | 109.05 | 109 | 108.94 | | 200 day SMA | 104.63 | 104.51 | 104.4 |
|
|
