SatiPoly SATIPOLY_SM full analysis,charts,indicators,moving averages,SMA,DMA,EMA,ADX,MACD,RSISati Poly SATIPOLY_SM WideScreen charts, DMA,SMA,EMA technical analysis, forecast prediction, by indicators ADX,MACD,RSI,CCI NSE stock exchange
Daily price and charts and targets SatiPoly Strong Daily Stock price targets for SatiPoly SATIPOLY_SM are 69.6 and 71.5 | Daily Target 1 | 69.13 | | Daily Target 2 | 70.07 | | Daily Target 3 | 71.033333333333 | | Daily Target 4 | 71.97 | | Daily Target 5 | 72.93 |
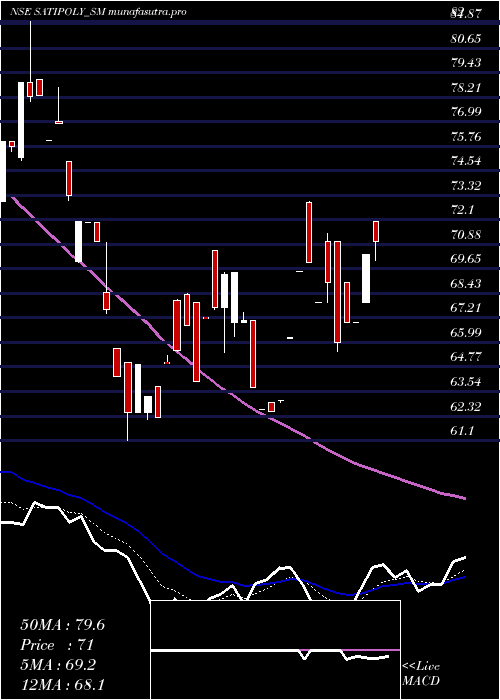
Daily price and volume Sati Poly
| Date |
Closing |
Open |
Range |
Volume |
Wed 29 October 2025 |
71.00 (0.92%) |
72.00 |
70.10 - 72.00 |
1.1628 times |
Tue 28 October 2025 |
70.35 (5%) |
68.00 |
68.00 - 70.35 |
3.0233 times |
Mon 27 October 2025 |
67.00 (0%) |
67.00 |
67.00 - 67.00 |
0.0775 times |
Fri 24 October 2025 |
67.00 (1.52%) |
69.00 |
67.00 - 69.00 |
0.3876 times |
Thu 23 October 2025 |
66.00 (-4.35%) |
71.00 |
65.55 - 71.00 |
1.4729 times |
Tue 21 October 2025 |
69.00 (1.47%) |
71.00 |
68.00 - 71.40 |
0.5426 times |
Mon 20 October 2025 |
68.00 (-2.86%) |
68.00 |
68.00 - 68.00 |
0.3101 times |
Fri 17 October 2025 |
70.00 (0.65%) |
72.95 |
70.00 - 73.00 |
0.8527 times |
Thu 16 October 2025 |
69.55 (4.98%) |
69.55 |
69.55 - 69.55 |
1.8605 times |
Wed 15 October 2025 |
66.25 (4.99%) |
66.20 |
66.20 - 66.25 |
0.3101 times |
Tue 14 October 2025 |
63.10 (0.88%) |
63.10 |
63.00 - 63.10 |
0.3101 times |
Weekly price and charts SatiPoly Strong weekly Stock price targets for SatiPoly SATIPOLY_SM are 69 and 74 | Weekly Target 1 | 65 | | Weekly Target 2 | 68 | | Weekly Target 3 | 70 | | Weekly Target 4 | 73 | | Weekly Target 5 | 75 |
Weekly price and volumes for Sati Poly
| Date |
Closing |
Open |
Range |
Volume |
Wed 29 October 2025 |
71.00 (5.97%) |
67.00 |
67.00 - 72.00 |
0.9857 times |
Fri 24 October 2025 |
67.00 (-4.29%) |
68.00 |
65.55 - 71.40 |
0.6272 times |
Fri 17 October 2025 |
70.00 (11.73%) |
63.00 |
62.55 - 73.00 |
0.8602 times |
Fri 10 October 2025 |
62.65 (-7.53%) |
67.75 |
62.65 - 69.50 |
0.914 times |
Fri 03 October 2025 |
67.75 (3.28%) |
68.40 |
64.05 - 70.55 |
0.6093 times |
Fri 26 September 2025 |
65.60 (4.96%) |
62.50 |
62.15 - 68.15 |
1.6846 times |
Fri 19 September 2025 |
62.50 (-13.19%) |
71.95 |
61.10 - 71.95 |
2.2043 times |
Fri 12 September 2025 |
72.00 (-7.99%) |
79.10 |
70.00 - 79.10 |
1.5233 times |
Fri 05 September 2025 |
78.25 (1.89%) |
73.00 |
73.00 - 82.00 |
0.3943 times |
Fri 29 August 2025 |
76.80 (-7.36%) |
79.60 |
76.60 - 84.45 |
0.1971 times |
Fri 22 August 2025 |
82.90 (2.73%) |
75.50 |
74.00 - 88.25 |
0.9677 times |

Monthly price and charts SatiPoly Strong monthly Stock price targets for SatiPoly SATIPOLY_SM are 66.78 and 77.23 | Monthly Target 1 | 58.4 | | Monthly Target 2 | 64.7 | | Monthly Target 3 | 68.85 | | Monthly Target 4 | 75.15 | | Monthly Target 5 | 79.3 |
Monthly price and volumes Sati Poly
| Date |
Closing |
Open |
Range |
Volume |
Wed 29 October 2025 |
71.00 (10.85%) |
67.25 |
62.55 - 73.00 |
0.4902 times |
Tue 30 September 2025 |
64.05 (-16.6%) |
73.00 |
61.10 - 82.00 |
0.8307 times |
Fri 29 August 2025 |
76.80 (-8.24%) |
60.15 |
60.15 - 88.25 |
0.5192 times |
Thu 13 March 2025 |
83.70 (-39.81%) |
130.00 |
83.70 - 130.00 |
0.4637 times |
Thu 27 February 2025 |
139.05 (-18.68%) |
170.00 |
137.00 - 180.00 |
0.4081 times |
Fri 31 January 2025 |
171.00 (-11.4%) |
198.70 |
155.00 - 204.00 |
0.2946 times |
Tue 31 December 2024 |
193.00 (-2.92%) |
207.70 |
193.00 - 220.00 |
0.7341 times |
Fri 29 November 2024 |
198.80 (-17.87%) |
242.00 |
194.50 - 268.70 |
2.8496 times |
Thu 31 October 2024 |
242.05 (20%) |
201.75 |
193.20 - 250.00 |
1.2606 times |
Mon 30 September 2024 |
201.70 (-9.96%) |
220.00 |
200.00 - 254.00 |
2.1492 times |
Fri 30 August 2024 |
224.00 (0%) |
199.00 |
177.00 - 251.75 |
3.6416 times |

DMA SMA EMA moving averages of Sati Poly SATIPOLY_SM
DMA (daily moving average) of Sati Poly SATIPOLY_SM
| DMA period | DMA value | | 5 day DMA | 68.27 | | 12 day DMA | 67.48 | | 20 day DMA | 67.06 | | 35 day DMA | 67.56 | | 50 day DMA | 71.52 | | 100 day DMA | 114.34 | | 150 day DMA | 147.35 | | 200 day DMA | | EMA (exponential moving average) of Sati Poly SATIPOLY_SM
| EMA period | EMA current | EMA prev | EMA prev2 | | 5 day EMA | 69.16 | 68.24 | 67.19 | | 12 day EMA | 68.06 | 67.53 | 67.02 | | 20 day EMA | 67.92 | 67.6 | 67.31 | | 35 day EMA | 69.7 | 69.62 | 69.58 | | 50 day EMA | 71.54 | 71.56 | 71.61 |
SMA (simple moving average) of Sati Poly SATIPOLY_SM
| SMA period | SMA current | SMA prev | SMA prev2 | | 5 day SMA | 68.27 | 67.87 | 67.4 | | 12 day SMA | 67.48 | 66.79 | 66.24 | | 20 day SMA | 67.06 | 66.85 | 66.62 | | 35 day SMA | 67.56 | 67.77 | 68 | | 50 day SMA | 71.52 | 71.56 | 71.49 | | 100 day SMA | 114.34 | 115.67 | 116.97 | | 150 day SMA | 147.35 | 148.17 | 149.03 | | 200 day SMA |
|
|
