SatiaIndustries SATIA full analysis,charts,indicators,moving averages,SMA,DMA,EMA,ADX,MACD,RSISatia Industries SATIA WideScreen charts, DMA,SMA,EMA technical analysis, forecast prediction, by indicators ADX,MACD,RSI,CCI NSE stock exchange
Daily price and charts and targets SatiaIndustries Strong Daily Stock price targets for SatiaIndustries SATIA are 76.84 and 77.95 | Daily Target 1 | 75.94 | | Daily Target 2 | 76.63 | | Daily Target 3 | 77.05 | | Daily Target 4 | 77.74 | | Daily Target 5 | 78.16 |
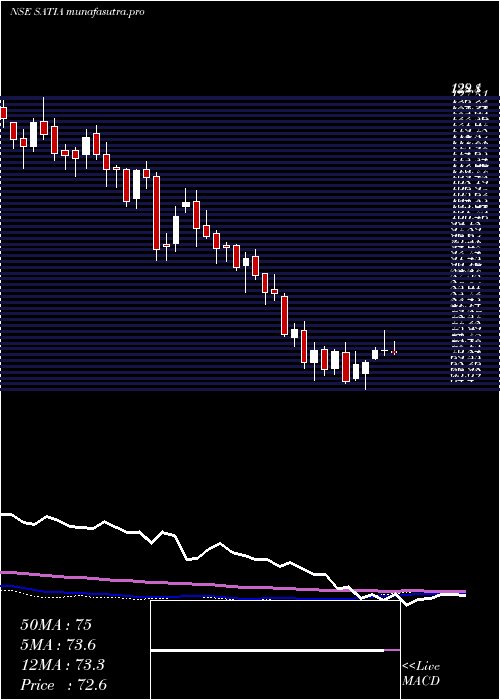
Daily price and volume Satia Industries
| Date |
Closing |
Open |
Range |
Volume |
Wed 29 October 2025 |
77.32 (1.23%) |
76.38 |
76.36 - 77.47 |
0.8454 times |
Tue 28 October 2025 |
76.38 (-0.83%) |
77.00 |
76.00 - 77.37 |
0.8517 times |
Mon 27 October 2025 |
77.02 (-0.98%) |
77.78 |
76.90 - 78.21 |
1.1991 times |
Fri 24 October 2025 |
77.78 (-0.46%) |
77.55 |
77.50 - 78.99 |
0.6219 times |
Thu 23 October 2025 |
78.14 (-0.13%) |
78.05 |
77.02 - 79.21 |
1.6264 times |
Tue 21 October 2025 |
78.24 (1.78%) |
77.78 |
77.01 - 78.50 |
0.3002 times |
Mon 20 October 2025 |
76.87 (-1.59%) |
78.11 |
76.25 - 79.23 |
2.4651 times |
Fri 17 October 2025 |
78.11 (-1.06%) |
79.10 |
77.99 - 79.50 |
0.7031 times |
Thu 16 October 2025 |
78.95 (-0.25%) |
79.00 |
78.60 - 79.81 |
0.6753 times |
Wed 15 October 2025 |
79.15 (0.93%) |
78.42 |
78.37 - 79.81 |
0.7117 times |
Tue 14 October 2025 |
78.42 (-1.89%) |
79.93 |
78.00 - 80.23 |
1.0931 times |

Weekly price and charts SatiaIndustries Strong weekly Stock price targets for SatiaIndustries SATIA are 75.56 and 77.77 | Weekly Target 1 | 74.97 | | Weekly Target 2 | 76.14 | | Weekly Target 3 | 77.176666666667 | | Weekly Target 4 | 78.35 | | Weekly Target 5 | 79.39 |
Weekly price and volumes for Satia Industries
| Date |
Closing |
Open |
Range |
Volume |
Wed 29 October 2025 |
77.32 (-0.59%) |
77.78 |
76.00 - 78.21 |
0.5519 times |
Fri 24 October 2025 |
77.78 (-0.42%) |
78.11 |
76.25 - 79.23 |
0.9553 times |
Fri 17 October 2025 |
78.11 (-2.01%) |
79.71 |
77.99 - 80.23 |
0.7445 times |
Fri 10 October 2025 |
79.71 (-4.1%) |
83.80 |
79.15 - 83.80 |
0.6586 times |
Fri 03 October 2025 |
83.12 (4.4%) |
79.62 |
78.40 - 83.69 |
0.8944 times |
Fri 26 September 2025 |
79.62 (-4.46%) |
83.34 |
79.00 - 83.74 |
0.8948 times |
Fri 19 September 2025 |
83.34 (-0.05%) |
83.15 |
83.00 - 85.73 |
0.6876 times |
Fri 12 September 2025 |
83.38 (1.32%) |
82.62 |
81.37 - 86.00 |
0.984 times |
Fri 05 September 2025 |
82.29 (0.78%) |
81.60 |
81.50 - 85.40 |
0.7319 times |
Fri 29 August 2025 |
81.65 (-2.55%) |
83.40 |
81.26 - 90.70 |
2.8971 times |
Fri 22 August 2025 |
83.79 (4.62%) |
80.09 |
80.09 - 88.56 |
0.9781 times |
Monthly price and charts SatiaIndustries Strong monthly Stock price targets for SatiaIndustries SATIA are 72.76 and 80.56 | Monthly Target 1 | 71.24 | | Monthly Target 2 | 74.28 | | Monthly Target 3 | 79.04 | | Monthly Target 4 | 82.08 | | Monthly Target 5 | 86.84 |
Monthly price and volumes Satia Industries
| Date |
Closing |
Open |
Range |
Volume |
Wed 29 October 2025 |
77.32 (-3.55%) |
80.17 |
76.00 - 83.80 |
0.3361 times |
Tue 30 September 2025 |
80.17 (-1.81%) |
81.60 |
78.40 - 86.00 |
0.3698 times |
Fri 29 August 2025 |
81.65 (-4.19%) |
85.29 |
78.51 - 90.70 |
0.6081 times |
Thu 31 July 2025 |
85.22 (-7.84%) |
92.90 |
82.38 - 95.48 |
0.7061 times |
Mon 30 June 2025 |
92.47 (18.34%) |
78.00 |
77.00 - 97.50 |
1.836 times |
Fri 30 May 2025 |
78.14 (7.57%) |
72.96 |
66.21 - 82.99 |
0.8752 times |
Wed 30 April 2025 |
72.64 (9.86%) |
66.80 |
64.40 - 77.58 |
0.9415 times |
Fri 28 March 2025 |
66.12 (-5.97%) |
70.32 |
65.80 - 74.85 |
2.2231 times |
Fri 28 February 2025 |
70.32 (-18.21%) |
86.50 |
69.00 - 89.95 |
1.0684 times |
Fri 31 January 2025 |
85.98 (-10.03%) |
95.68 |
83.28 - 96.95 |
1.0357 times |
Tue 31 December 2024 |
95.56 (-6.94%) |
104.89 |
92.19 - 108.90 |
1.8628 times |

DMA SMA EMA moving averages of Satia Industries SATIA
DMA (daily moving average) of Satia Industries SATIA
| DMA period | DMA value | | 5 day DMA | 77.33 | | 12 day DMA | 78.03 | | 20 day DMA | 79.22 | | 35 day DMA | 80.57 | | 50 day DMA | 81.4 | | 100 day DMA | 83.56 | | 150 day DMA | 80.37 | | 200 day DMA | 80.57 | EMA (exponential moving average) of Satia Industries SATIA
| EMA period | EMA current | EMA prev | EMA prev2 | | 5 day EMA | 77.29 | 77.27 | 77.71 | | 12 day EMA | 78.06 | 78.2 | 78.53 | | 20 day EMA | 78.84 | 79 | 79.28 | | 35 day EMA | 79.91 | 80.06 | 80.28 | | 50 day EMA | 80.91 | 81.06 | 81.25 |
SMA (simple moving average) of Satia Industries SATIA
| SMA period | SMA current | SMA prev | SMA prev2 | | 5 day SMA | 77.33 | 77.51 | 77.61 | | 12 day SMA | 78.03 | 78.23 | 78.52 | | 20 day SMA | 79.22 | 79.29 | 79.45 | | 35 day SMA | 80.57 | 80.73 | 80.9 | | 50 day SMA | 81.4 | 81.45 | 81.53 | | 100 day SMA | 83.56 | 83.59 | 83.61 | | 150 day SMA | 80.37 | 80.33 | 80.29 | | 200 day SMA | 80.57 | 80.64 | 80.72 |
|
|
