SA SATECH_SM full analysis,charts,indicators,moving averages,SMA,DMA,EMA,ADX,MACD,RSIS A SATECH_SM WideScreen charts, DMA,SMA,EMA technical analysis, forecast prediction, by indicators ADX,MACD,RSI,CCI NSE stock exchange
Daily price and charts and targets SA Strong Daily Stock price targets for SA SATECH_SM are 50.8 and 52.45 | Daily Target 1 | 50.52 | | Daily Target 2 | 51.08 | | Daily Target 3 | 52.166666666667 | | Daily Target 4 | 52.73 | | Daily Target 5 | 53.82 |
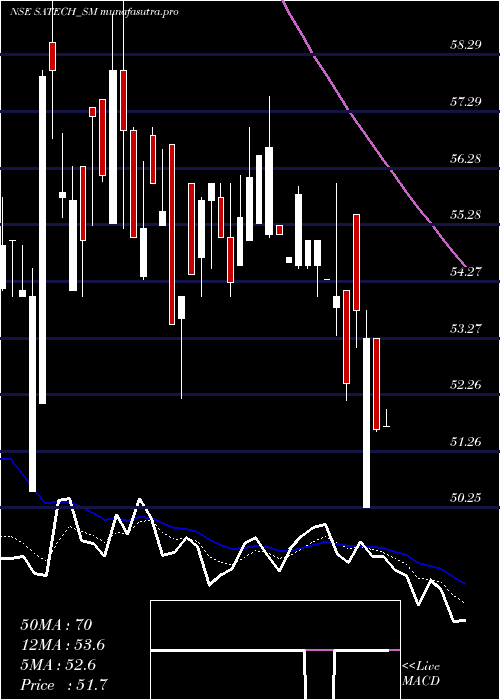
Daily price and volume S A
| Date |
Closing |
Open |
Range |
Volume |
Wed 29 October 2025 |
51.65 (-3%) |
53.25 |
51.60 - 53.25 |
1.3725 times |
Tue 28 October 2025 |
53.25 (-0.93%) |
50.25 |
50.25 - 53.75 |
1.2745 times |
Mon 27 October 2025 |
53.75 (2.48%) |
55.45 |
53.10 - 55.45 |
1.0784 times |
Fri 24 October 2025 |
52.45 (-2.87%) |
54.10 |
52.15 - 54.10 |
1.2745 times |
Thu 23 October 2025 |
54.00 (-0.55%) |
53.80 |
53.30 - 56.00 |
1.5686 times |
Tue 21 October 2025 |
54.30 (-1.27%) |
54.30 |
54.30 - 54.30 |
0.098 times |
Mon 20 October 2025 |
55.00 (0%) |
54.55 |
54.00 - 55.00 |
0.9804 times |
Fri 17 October 2025 |
55.00 (-1.43%) |
54.55 |
54.50 - 55.00 |
1.0784 times |
Thu 16 October 2025 |
55.80 (2.01%) |
54.55 |
54.50 - 55.95 |
0.9804 times |
Wed 15 October 2025 |
54.70 (-0.73%) |
54.60 |
54.60 - 54.70 |
0.2941 times |
Tue 14 October 2025 |
55.10 (-2.74%) |
55.25 |
55.10 - 55.25 |
0.2941 times |
Weekly price and charts SA Strong weekly Stock price targets for SA SATECH_SM are 48.35 and 53.55 | Weekly Target 1 | 47.25 | | Weekly Target 2 | 49.45 | | Weekly Target 3 | 52.45 | | Weekly Target 4 | 54.65 | | Weekly Target 5 | 57.65 |
Weekly price and volumes for S A
| Date |
Closing |
Open |
Range |
Volume |
Wed 29 October 2025 |
51.65 (-1.53%) |
55.45 |
50.25 - 55.45 |
0.7076 times |
Fri 24 October 2025 |
52.45 (-4.64%) |
54.55 |
52.15 - 56.00 |
0.7449 times |
Fri 17 October 2025 |
55.00 (-2.65%) |
55.10 |
54.50 - 57.55 |
1.1359 times |
Fri 10 October 2025 |
56.50 (0.89%) |
55.75 |
54.00 - 57.00 |
0.7076 times |
Fri 03 October 2025 |
56.00 (4.67%) |
53.60 |
52.20 - 56.00 |
0.838 times |
Fri 26 September 2025 |
53.50 (-6.06%) |
56.95 |
53.50 - 57.00 |
0.8752 times |
Fri 19 September 2025 |
56.95 (2.24%) |
56.30 |
54.00 - 59.45 |
1.6015 times |
Fri 12 September 2025 |
55.70 (2.96%) |
50.55 |
50.55 - 59.95 |
1.5084 times |
Fri 05 September 2025 |
54.10 (-4.5%) |
57.00 |
54.00 - 57.20 |
1.0987 times |
Fri 29 August 2025 |
56.65 (-2.83%) |
55.70 |
55.45 - 58.00 |
0.7821 times |
Fri 22 August 2025 |
58.30 (4.11%) |
55.00 |
55.00 - 59.45 |
1.3594 times |

Monthly price and charts SA Strong monthly Stock price targets for SA SATECH_SM are 47.3 and 54.6 | Monthly Target 1 | 45.85 | | Monthly Target 2 | 48.75 | | Monthly Target 3 | 53.15 | | Monthly Target 4 | 56.05 | | Monthly Target 5 | 60.45 |
Monthly price and volumes S A
| Date |
Closing |
Open |
Range |
Volume |
Wed 29 October 2025 |
51.65 (-5.06%) |
54.70 |
50.25 - 57.55 |
0.0958 times |
Tue 30 September 2025 |
54.40 (-3.97%) |
57.00 |
50.55 - 59.95 |
0.1437 times |
Fri 29 August 2025 |
56.65 (-62.31%) |
57.00 |
52.70 - 59.45 |
0.0973 times |
Tue 08 October 2024 |
150.30 (-4.87%) |
159.20 |
137.75 - 165.85 |
0.2758 times |
Mon 30 September 2024 |
158.00 (-23.67%) |
202.20 |
157.50 - 210.70 |
1.921 times |
Fri 30 August 2024 |
207.00 (0%) |
134.00 |
129.45 - 250.00 |
3.4665 times |
Wed 29 October 2025 |
(0%) |
|
- |
0 times |

DMA SMA EMA moving averages of S A SATECH_SM
DMA (daily moving average) of S A SATECH_SM
| DMA period | DMA value | | 5 day DMA | 53.02 | | 12 day DMA | 54.3 | | 20 day DMA | 54.75 | | 35 day DMA | 55.29 | | 50 day DMA | 55.57 | | 100 day DMA | | | 150 day DMA | | | 200 day DMA | | EMA (exponential moving average) of S A SATECH_SM
| EMA period | EMA current | EMA prev | EMA prev2 | | 5 day EMA | 52.98 | 53.64 | 53.84 | | 12 day EMA | 53.89 | 54.3 | 54.49 | | 20 day EMA | 54.41 | 54.7 | 54.85 | | 35 day EMA | 54.94 | 55.13 | 55.24 | | 50 day EMA | 55.28 | 55.43 | 55.52 |
SMA (simple moving average) of S A SATECH_SM
| SMA period | SMA current | SMA prev | SMA prev2 | | 5 day SMA | 53.02 | 53.55 | 53.9 | | 12 day SMA | 54.3 | 54.71 | 54.95 | | 20 day SMA | 54.75 | 54.87 | 54.88 | | 35 day SMA | 55.29 | 55.35 | 55.38 | | 50 day SMA | 55.57 | 55.66 | 55.73 | | 100 day SMA | | 150 day SMA | | 200 day SMA |
|
|
