SastasundarVentures SASTASUNDR full analysis,charts,indicators,moving averages,SMA,DMA,EMA,ADX,MACD,RSISastasundar Ventures SASTASUNDR WideScreen charts, DMA,SMA,EMA technical analysis, forecast prediction, by indicators ADX,MACD,RSI,CCI NSE stock exchange
operates under Other Financial Services sector
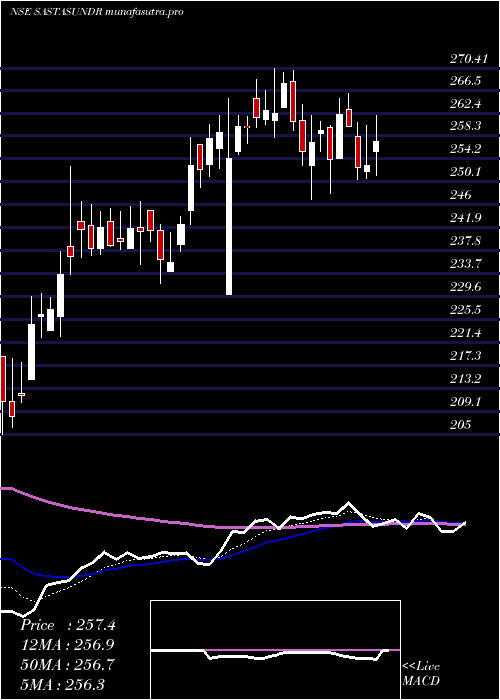
Daily price and charts and targets SastasundarVentures Strong Daily Stock price targets for SastasundarVentures SASTASUNDR are 294.45 and 302.45 | Daily Target 1 | 292.63 | | Daily Target 2 | 296.27 | | Daily Target 3 | 300.63333333333 | | Daily Target 4 | 304.27 | | Daily Target 5 | 308.63 |
Daily price and volume Sastasundar Ventures
| Date |
Closing |
Open |
Range |
Volume |
Tue 28 October 2025 |
299.90 (-1.25%) |
303.50 |
297.00 - 305.00 |
0.7637 times |
Mon 27 October 2025 |
303.70 (0.55%) |
303.50 |
298.55 - 309.90 |
0.7142 times |
Fri 24 October 2025 |
302.05 (-0.56%) |
306.00 |
300.35 - 309.00 |
0.8939 times |
Thu 23 October 2025 |
303.75 (-0.93%) |
306.60 |
302.40 - 318.70 |
3.8594 times |
Tue 21 October 2025 |
306.60 (-0.82%) |
310.05 |
305.00 - 317.95 |
0.134 times |
Mon 20 October 2025 |
309.15 (1.26%) |
304.00 |
300.00 - 310.00 |
0.8403 times |
Fri 17 October 2025 |
305.30 (-1.52%) |
308.10 |
297.05 - 315.00 |
1.2068 times |
Thu 16 October 2025 |
310.00 (-0.05%) |
316.00 |
308.00 - 318.70 |
0.6509 times |
Wed 15 October 2025 |
310.15 (-0.14%) |
313.85 |
302.05 - 314.00 |
0.3796 times |
Tue 14 October 2025 |
310.60 (1.29%) |
303.00 |
303.00 - 316.00 |
0.5572 times |
Mon 13 October 2025 |
306.65 (-1.08%) |
314.60 |
304.00 - 314.60 |
0.2234 times |
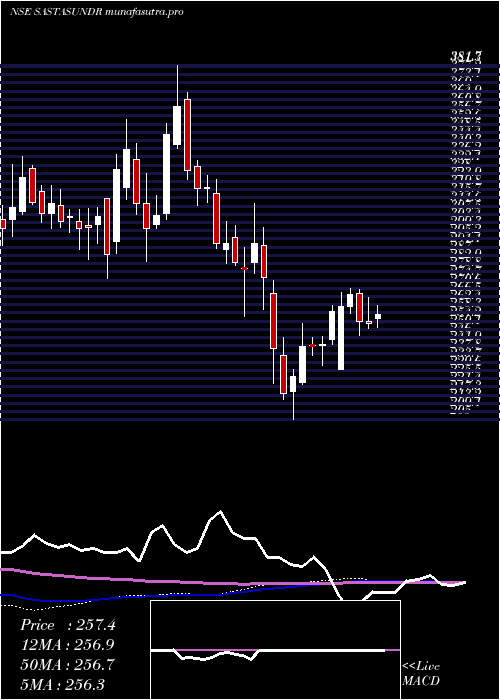
Weekly price and charts SastasundarVentures Strong weekly Stock price targets for SastasundarVentures SASTASUNDR are 292 and 304.9 | Weekly Target 1 | 289.37 | | Weekly Target 2 | 294.63 | | Weekly Target 3 | 302.26666666667 | | Weekly Target 4 | 307.53 | | Weekly Target 5 | 315.17 |
Weekly price and volumes for Sastasundar Ventures
| Date |
Closing |
Open |
Range |
Volume |
Tue 28 October 2025 |
299.90 (-0.71%) |
303.50 |
297.00 - 309.90 |
0.118 times |
Fri 24 October 2025 |
302.05 (-1.06%) |
304.00 |
300.00 - 318.70 |
0.4572 times |
Fri 17 October 2025 |
305.30 (-1.52%) |
314.60 |
297.05 - 318.70 |
0.2409 times |
Fri 10 October 2025 |
310.00 (-1.12%) |
315.00 |
305.00 - 320.00 |
0.3717 times |
Fri 03 October 2025 |
313.50 (0.1%) |
316.35 |
303.00 - 328.00 |
0.2868 times |
Fri 26 September 2025 |
313.20 (0.27%) |
307.00 |
301.20 - 338.00 |
1.3989 times |
Fri 19 September 2025 |
312.35 (2.56%) |
306.90 |
298.25 - 328.00 |
1.3179 times |
Fri 12 September 2025 |
304.55 (11.23%) |
272.25 |
268.50 - 323.60 |
5.6159 times |
Fri 05 September 2025 |
273.80 (0.46%) |
273.75 |
267.00 - 288.90 |
0.1278 times |
Fri 29 August 2025 |
272.55 (0.02%) |
273.55 |
267.55 - 275.90 |
0.0649 times |
Fri 22 August 2025 |
272.50 (0.35%) |
274.00 |
268.85 - 281.45 |
0.1282 times |
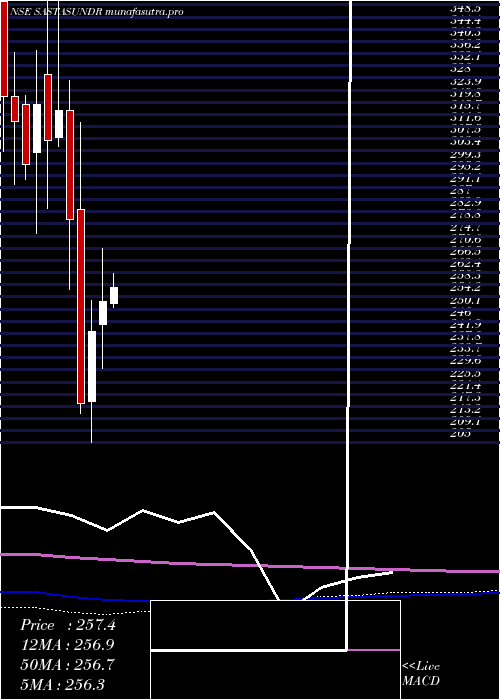
Monthly price and charts SastasundarVentures Strong monthly Stock price targets for SastasundarVentures SASTASUNDR are 282.95 and 313.95 | Monthly Target 1 | 277.3 | | Monthly Target 2 | 288.6 | | Monthly Target 3 | 308.3 | | Monthly Target 4 | 319.6 | | Monthly Target 5 | 339.3 |
Monthly price and volumes Sastasundar Ventures
| Date |
Closing |
Open |
Range |
Volume |
Tue 28 October 2025 |
299.90 (-1.69%) |
305.95 |
297.00 - 328.00 |
0.4737 times |
Tue 30 September 2025 |
305.05 (11.92%) |
273.75 |
267.00 - 338.00 |
3.0203 times |
Fri 29 August 2025 |
272.55 (-4.44%) |
285.50 |
266.35 - 295.70 |
0.2545 times |
Thu 31 July 2025 |
285.20 (-3.94%) |
297.00 |
266.20 - 317.00 |
0.5503 times |
Mon 30 June 2025 |
296.90 (11.14%) |
262.50 |
257.05 - 342.00 |
1.4896 times |
Fri 30 May 2025 |
267.15 (5.71%) |
252.00 |
241.60 - 277.10 |
0.3381 times |
Wed 30 April 2025 |
252.73 (4.25%) |
245.00 |
230.00 - 270.41 |
0.4162 times |
Fri 28 March 2025 |
242.42 (11.07%) |
219.00 |
205.00 - 252.85 |
1.3716 times |
Fri 28 February 2025 |
218.25 (-22.16%) |
283.60 |
215.00 - 313.00 |
1.2603 times |
Fri 31 January 2025 |
280.40 (-11.5%) |
316.85 |
256.55 - 327.00 |
0.8254 times |
Tue 31 December 2024 |
316.85 (3.19%) |
307.95 |
305.00 - 381.70 |
2.5578 times |
DMA SMA EMA moving averages of Sastasundar Ventures SASTASUNDR
DMA (daily moving average) of Sastasundar Ventures SASTASUNDR
| DMA period | DMA value | | 5 day DMA | 303.2 | | 12 day DMA | 306.49 | | 20 day DMA | 308.19 | | 35 day DMA | 307.18 | | 50 day DMA | 297.03 | | 100 day DMA | 292.69 | | 150 day DMA | 280.82 | | 200 day DMA | 276.74 | EMA (exponential moving average) of Sastasundar Ventures SASTASUNDR
| EMA period | EMA current | EMA prev | EMA prev2 | | 5 day EMA | 303.03 | 304.6 | 305.05 | | 12 day EMA | 305.55 | 306.58 | 307.1 | | 20 day EMA | 305.97 | 306.61 | 306.92 | | 35 day EMA | 301.33 | 301.41 | 301.28 | | 50 day EMA | 296.52 | 296.38 | 296.08 |
SMA (simple moving average) of Sastasundar Ventures SASTASUNDR
| SMA period | SMA current | SMA prev | SMA prev2 | | 5 day SMA | 303.2 | 305.05 | 305.37 | | 12 day SMA | 306.49 | 307.19 | 307.93 | | 20 day SMA | 308.19 | 308.85 | 309.18 | | 35 day SMA | 307.18 | 306.43 | 305.56 | | 50 day SMA | 297.03 | 296.57 | 296.1 | | 100 day SMA | 292.69 | 292.28 | 291.86 | | 150 day SMA | 280.82 | 280.41 | 280 | | 200 day SMA | 276.74 | 276.78 | 276.87 |
|
|
