SapphireFoods SAPPHIRE full analysis,charts,indicators,moving averages,SMA,DMA,EMA,ADX,MACD,RSISapphire Foods SAPPHIRE WideScreen charts, DMA,SMA,EMA technical analysis, forecast prediction, by indicators ADX,MACD,RSI,CCI NSE stock exchange
Daily price and charts and targets SapphireFoods Strong Daily Stock price targets for SapphireFoods SAPPHIRE are 274.95 and 284.2 | Daily Target 1 | 273.3 | | Daily Target 2 | 276.6 | | Daily Target 3 | 282.55 | | Daily Target 4 | 285.85 | | Daily Target 5 | 291.8 |
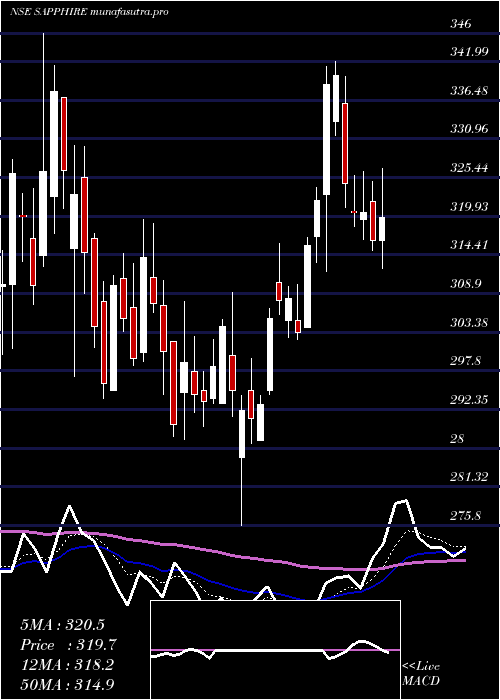
Daily price and volume Sapphire Foods
| Date |
Closing |
Open |
Range |
Volume |
Tue 28 October 2025 |
279.90 (-1.55%) |
285.80 |
279.25 - 288.50 |
1.3422 times |
Mon 27 October 2025 |
284.30 (-0.73%) |
288.85 |
282.70 - 296.50 |
1.124 times |
Fri 24 October 2025 |
286.40 (-1.24%) |
290.00 |
284.15 - 290.90 |
0.3542 times |
Thu 23 October 2025 |
290.00 (-1.54%) |
295.95 |
289.25 - 298.95 |
0.856 times |
Tue 21 October 2025 |
294.55 (2.72%) |
289.95 |
289.75 - 299.00 |
0.4374 times |
Mon 20 October 2025 |
286.75 (-0.55%) |
288.00 |
285.95 - 290.05 |
0.858 times |
Fri 17 October 2025 |
288.35 (0.21%) |
285.00 |
284.40 - 293.00 |
1.527 times |
Thu 16 October 2025 |
287.75 (2.66%) |
280.30 |
277.25 - 293.20 |
1.391 times |
Wed 15 October 2025 |
280.30 (1.3%) |
277.80 |
273.55 - 282.25 |
1.3205 times |
Tue 14 October 2025 |
276.70 (-0.7%) |
280.00 |
274.80 - 281.90 |
0.7896 times |
Mon 13 October 2025 |
278.65 (-0.2%) |
277.00 |
271.40 - 284.95 |
1.1502 times |
Weekly price and charts SapphireFoods Strong weekly Stock price targets for SapphireFoods SAPPHIRE are 270.95 and 288.2 | Weekly Target 1 | 267.97 | | Weekly Target 2 | 273.93 | | Weekly Target 3 | 285.21666666667 | | Weekly Target 4 | 291.18 | | Weekly Target 5 | 302.47 |
Weekly price and volumes for Sapphire Foods
| Date |
Closing |
Open |
Range |
Volume |
Tue 28 October 2025 |
279.90 (-2.27%) |
288.85 |
279.25 - 296.50 |
0.427 times |
Fri 24 October 2025 |
286.40 (-0.68%) |
288.00 |
284.15 - 299.00 |
0.4338 times |
Fri 17 October 2025 |
288.35 (3.28%) |
277.00 |
271.40 - 293.20 |
1.0697 times |
Fri 10 October 2025 |
279.20 (-4.94%) |
293.65 |
277.30 - 297.40 |
0.6242 times |
Fri 03 October 2025 |
293.70 (-2.46%) |
301.20 |
290.70 - 305.60 |
0.7197 times |
Fri 26 September 2025 |
301.10 (-5.4%) |
314.10 |
298.50 - 318.85 |
0.7814 times |
Fri 19 September 2025 |
318.30 (-3.19%) |
329.45 |
315.00 - 333.30 |
1.0433 times |
Fri 12 September 2025 |
328.80 (2.35%) |
321.40 |
315.35 - 338.00 |
3.3203 times |
Fri 05 September 2025 |
321.25 (-1.77%) |
329.45 |
316.00 - 347.90 |
1.2908 times |
Fri 29 August 2025 |
327.05 (0.02%) |
326.35 |
317.80 - 329.80 |
0.2897 times |
Fri 22 August 2025 |
327.00 (6.76%) |
311.00 |
307.50 - 333.00 |
0.4189 times |
Monthly price and charts SapphireFoods Strong monthly Stock price targets for SapphireFoods SAPPHIRE are 261.4 and 289.9 | Monthly Target 1 | 255.23 | | Monthly Target 2 | 267.57 | | Monthly Target 3 | 283.73333333333 | | Monthly Target 4 | 296.07 | | Monthly Target 5 | 312.23 |
Monthly price and volumes Sapphire Foods
| Date |
Closing |
Open |
Range |
Volume |
Tue 28 October 2025 |
279.90 (-4.73%) |
296.00 |
271.40 - 299.90 |
0.4261 times |
Tue 30 September 2025 |
293.80 (-10.17%) |
329.45 |
291.60 - 347.90 |
0.9346 times |
Fri 29 August 2025 |
327.05 (3.3%) |
317.50 |
293.60 - 333.00 |
0.3363 times |
Thu 31 July 2025 |
316.60 (-3.71%) |
328.70 |
312.35 - 368.00 |
3.1901 times |
Mon 30 June 2025 |
328.80 (3.36%) |
320.00 |
308.20 - 343.25 |
0.5415 times |
Fri 30 May 2025 |
318.10 (0.51%) |
316.50 |
290.10 - 340.00 |
0.8122 times |
Wed 30 April 2025 |
316.50 (7.49%) |
295.10 |
275.80 - 341.90 |
0.3523 times |
Fri 28 March 2025 |
294.45 (-5.09%) |
310.15 |
288.00 - 346.00 |
1.3467 times |
Fri 28 February 2025 |
310.25 (7.13%) |
305.00 |
284.85 - 346.00 |
1.0204 times |
Fri 31 January 2025 |
289.60 (-12.11%) |
333.00 |
283.70 - 374.65 |
1.0399 times |
Tue 31 December 2024 |
329.50 (1.01%) |
329.85 |
302.00 - 355.50 |
0.5981 times |

DMA SMA EMA moving averages of Sapphire Foods SAPPHIRE
DMA (daily moving average) of Sapphire Foods SAPPHIRE
| DMA period | DMA value | | 5 day DMA | 287.03 | | 12 day DMA | 284.4 | | 20 day DMA | 287.84 | | 35 day DMA | 301.22 | | 50 day DMA | 307.68 | | 100 day DMA | 317.38 | | 150 day DMA | 315.31 | | 200 day DMA | 315.02 | EMA (exponential moving average) of Sapphire Foods SAPPHIRE
| EMA period | EMA current | EMA prev | EMA prev2 | | 5 day EMA | 284.56 | 286.89 | 288.19 | | 12 day EMA | 286.88 | 288.15 | 288.85 | | 20 day EMA | 290.58 | 291.7 | 292.48 | | 35 day EMA | 297.69 | 298.74 | 299.59 | | 50 day EMA | 306.54 | 307.63 | 308.58 |
SMA (simple moving average) of Sapphire Foods SAPPHIRE
| SMA period | SMA current | SMA prev | SMA prev2 | | 5 day SMA | 287.03 | 288.4 | 289.21 | | 12 day SMA | 284.4 | 284.97 | 285.73 | | 20 day SMA | 287.84 | 288.9 | 290.09 | | 35 day SMA | 301.22 | 302.4 | 303.59 | | 50 day SMA | 307.68 | 308.39 | 309.15 | | 100 day SMA | 317.38 | 317.75 | 318.01 | | 150 day SMA | 315.31 | 315.48 | 315.65 | | 200 day SMA | 315.02 | 315.39 | 315.71 |
|
|
