SanghiIndustries SANGHIIND full analysis,charts,indicators,moving averages,SMA,DMA,EMA,ADX,MACD,RSISanghi Industries SANGHIIND WideScreen charts, DMA,SMA,EMA technical analysis, forecast prediction, by indicators ADX,MACD,RSI,CCI NSE stock exchange
operates under Cement & Cement Products sector
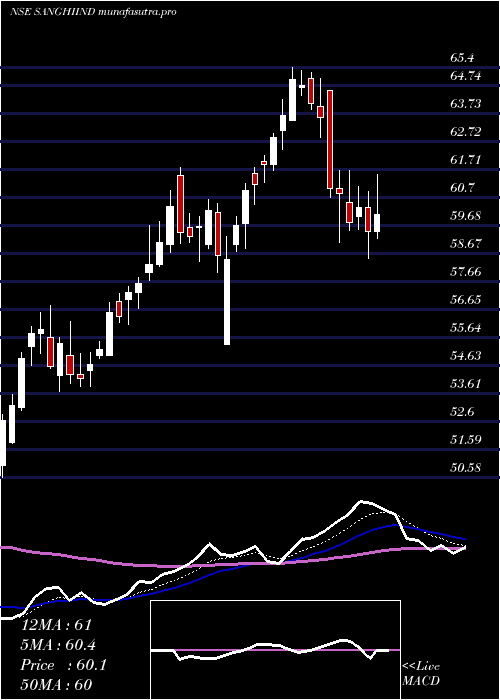
Daily price and charts and targets SanghiIndustries Strong Daily Stock price targets for SanghiIndustries SANGHIIND are 62.99 and 64.21 | Daily Target 1 | 62.76 | | Daily Target 2 | 63.22 | | Daily Target 3 | 63.976666666667 | | Daily Target 4 | 64.44 | | Daily Target 5 | 65.2 |
Daily price and volume Sanghi Industries
| Date |
Closing |
Open |
Range |
Volume |
Tue 28 October 2025 |
63.69 (-0.7%) |
64.14 |
63.51 - 64.73 |
0.5781 times |
Mon 27 October 2025 |
64.14 (0.6%) |
63.78 |
63.78 - 65.64 |
0.6919 times |
Fri 24 October 2025 |
63.76 (-1.29%) |
64.00 |
62.95 - 65.00 |
4.6802 times |
Thu 23 October 2025 |
64.59 (-0.14%) |
64.50 |
64.30 - 65.00 |
0.7123 times |
Tue 21 October 2025 |
64.68 (0.14%) |
64.70 |
64.60 - 65.38 |
0.3598 times |
Mon 20 October 2025 |
64.59 (0.94%) |
64.30 |
63.88 - 65.24 |
0.5517 times |
Fri 17 October 2025 |
63.99 (-1.37%) |
64.50 |
63.55 - 65.25 |
0.5869 times |
Thu 16 October 2025 |
64.88 (0.42%) |
64.98 |
64.16 - 65.10 |
0.4341 times |
Wed 15 October 2025 |
64.61 (0.83%) |
63.08 |
63.08 - 64.85 |
1.056 times |
Tue 14 October 2025 |
64.08 (-0.12%) |
63.32 |
63.06 - 64.30 |
0.3489 times |
Mon 13 October 2025 |
64.16 (-0.45%) |
64.45 |
63.50 - 64.55 |
0.3601 times |
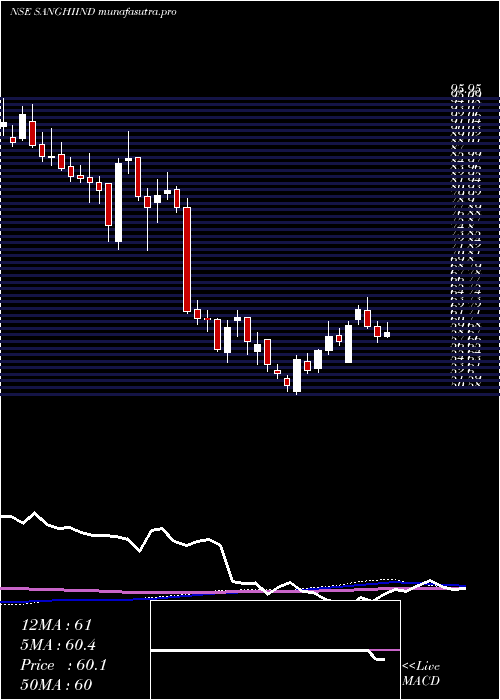
Weekly price and charts SanghiIndustries Strong weekly Stock price targets for SanghiIndustries SANGHIIND are 62.54 and 64.67 | Weekly Target 1 | 62.15 | | Weekly Target 2 | 62.92 | | Weekly Target 3 | 64.28 | | Weekly Target 4 | 65.05 | | Weekly Target 5 | 66.41 |
Weekly price and volumes for Sanghi Industries
| Date |
Closing |
Open |
Range |
Volume |
Tue 28 October 2025 |
63.69 (-0.11%) |
63.78 |
63.51 - 65.64 |
0.2794 times |
Fri 24 October 2025 |
63.76 (-0.36%) |
64.30 |
62.95 - 65.38 |
1.3869 times |
Fri 17 October 2025 |
63.99 (-0.71%) |
64.45 |
63.06 - 65.25 |
0.6129 times |
Fri 10 October 2025 |
64.45 (-1.18%) |
65.22 |
63.00 - 65.50 |
0.7919 times |
Fri 03 October 2025 |
65.22 (1.78%) |
64.08 |
63.14 - 65.60 |
0.6354 times |
Fri 26 September 2025 |
64.08 (-2.39%) |
65.87 |
63.90 - 68.20 |
2.5428 times |
Fri 19 September 2025 |
65.65 (3.39%) |
63.00 |
63.00 - 66.48 |
0.8692 times |
Fri 12 September 2025 |
63.50 (-1.09%) |
65.20 |
62.31 - 65.20 |
0.7077 times |
Fri 05 September 2025 |
64.20 (2.16%) |
63.41 |
63.02 - 67.50 |
0.7956 times |
Fri 29 August 2025 |
62.84 (-4.72%) |
66.46 |
62.60 - 66.46 |
1.3782 times |
Fri 22 August 2025 |
65.95 (2.22%) |
65.65 |
64.26 - 67.98 |
1.4294 times |
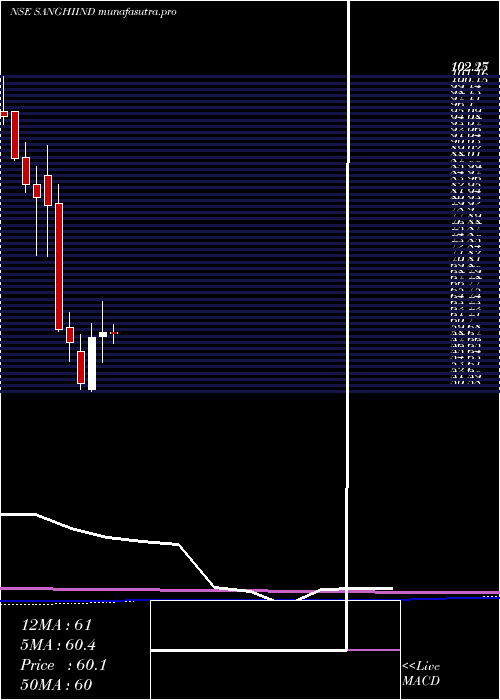
Monthly price and charts SanghiIndustries Strong monthly Stock price targets for SanghiIndustries SANGHIIND are 61.98 and 64.67 | Monthly Target 1 | 61.4 | | Monthly Target 2 | 62.55 | | Monthly Target 3 | 64.093333333333 | | Monthly Target 4 | 65.24 | | Monthly Target 5 | 66.78 |
Monthly price and volumes Sanghi Industries
| Date |
Closing |
Open |
Range |
Volume |
Tue 28 October 2025 |
63.69 (-1.09%) |
64.39 |
62.95 - 65.64 |
0.3372 times |
Tue 30 September 2025 |
64.39 (2.47%) |
63.41 |
62.31 - 68.20 |
0.4853 times |
Fri 29 August 2025 |
62.84 (-5.23%) |
66.31 |
62.60 - 69.00 |
0.4542 times |
Thu 31 July 2025 |
66.31 (2.98%) |
64.38 |
64.38 - 70.40 |
1.0493 times |
Mon 30 June 2025 |
64.39 (4.24%) |
61.60 |
58.47 - 64.70 |
0.8245 times |
Fri 30 May 2025 |
61.77 (2.37%) |
60.34 |
56.90 - 64.14 |
0.5873 times |
Wed 30 April 2025 |
60.34 (1.53%) |
59.60 |
55.40 - 65.40 |
1.0807 times |
Fri 28 March 2025 |
59.43 (14.53%) |
51.00 |
50.58 - 61.78 |
2.5644 times |
Fri 28 February 2025 |
51.89 (-11.53%) |
57.10 |
50.99 - 59.99 |
1.0881 times |
Fri 31 January 2025 |
58.65 (-3.41%) |
61.04 |
55.51 - 63.50 |
1.5291 times |
Tue 31 December 2024 |
60.72 (-25.18%) |
81.40 |
60.50 - 84.57 |
2.36 times |
DMA SMA EMA moving averages of Sanghi Industries SANGHIIND
DMA (daily moving average) of Sanghi Industries SANGHIIND
| DMA period | DMA value | | 5 day DMA | 64.17 | | 12 day DMA | 64.3 | | 20 day DMA | 64.33 | | 35 day DMA | 64.56 | | 50 day DMA | 64.62 | | 100 day DMA | 64.73 | | 150 day DMA | 63.47 | | 200 day DMA | 61.83 | EMA (exponential moving average) of Sanghi Industries SANGHIIND
| EMA period | EMA current | EMA prev | EMA prev2 | | 5 day EMA | 64.05 | 64.23 | 64.28 | | 12 day EMA | 64.25 | 64.35 | 64.39 | | 20 day EMA | 64.37 | 64.44 | 64.47 | | 35 day EMA | 64.49 | 64.54 | 64.56 | | 50 day EMA | 64.66 | 64.7 | 64.72 |
SMA (simple moving average) of Sanghi Industries SANGHIIND
| SMA period | SMA current | SMA prev | SMA prev2 | | 5 day SMA | 64.17 | 64.35 | 64.32 | | 12 day SMA | 64.3 | 64.32 | 64.3 | | 20 day SMA | 64.33 | 64.35 | 64.43 | | 35 day SMA | 64.56 | 64.58 | 64.57 | | 50 day SMA | 64.62 | 64.65 | 64.68 | | 100 day SMA | 64.73 | 64.7 | 64.67 | | 150 day SMA | 63.47 | 63.42 | 63.36 | | 200 day SMA | 61.83 | 61.82 | 61.81 |
|
|
