Sandesh SANDESH full analysis,charts,indicators,moving averages,SMA,DMA,EMA,ADX,MACD,RSISandesh SANDESH WideScreen charts, DMA,SMA,EMA technical analysis, forecast prediction, by indicators ADX,MACD,RSI,CCI NSE stock exchange
operates under Publishing sector
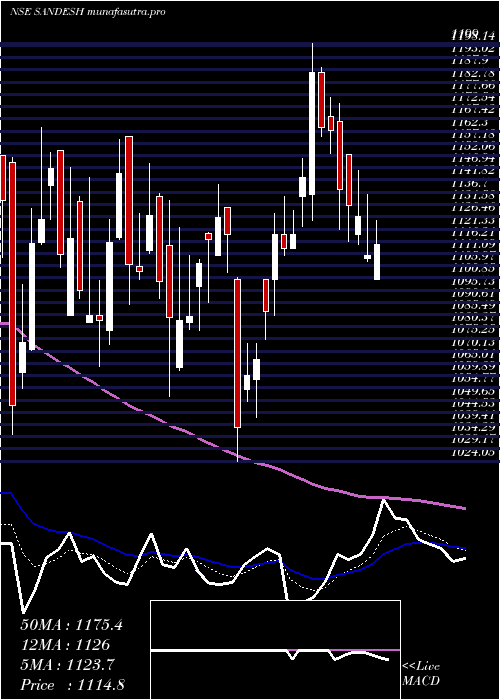
Daily price and charts and targets Sandesh Strong Daily Stock price targets for Sandesh SANDESH are 1157.25 and 1169.25 | Daily Target 1 | 1155.17 | | Daily Target 2 | 1159.33 | | Daily Target 3 | 1167.1666666667 | | Daily Target 4 | 1171.33 | | Daily Target 5 | 1179.17 |
Daily price and volume Sandesh
| Date |
Closing |
Open |
Range |
Volume |
Wed 29 October 2025 |
1163.50 (-0.74%) |
1175.00 |
1163.00 - 1175.00 |
0.5197 times |
Tue 28 October 2025 |
1172.20 (-1.01%) |
1189.50 |
1156.20 - 1189.50 |
1.5366 times |
Mon 27 October 2025 |
1184.20 (0.89%) |
1168.00 |
1166.00 - 1188.00 |
0.3457 times |
Fri 24 October 2025 |
1173.70 (1.83%) |
1162.00 |
1155.00 - 1185.00 |
1.2596 times |
Thu 23 October 2025 |
1152.60 (-1.5%) |
1176.00 |
1131.90 - 1176.00 |
0.9423 times |
Tue 21 October 2025 |
1170.20 (1.75%) |
1150.00 |
1150.00 - 1182.50 |
0.4676 times |
Mon 20 October 2025 |
1150.10 (-0.39%) |
1154.60 |
1144.00 - 1164.90 |
0.8358 times |
Fri 17 October 2025 |
1154.60 (-1.35%) |
1177.90 |
1130.10 - 1185.00 |
2.2339 times |
Thu 16 October 2025 |
1170.40 (0.22%) |
1169.00 |
1167.00 - 1185.90 |
1.2016 times |
Wed 15 October 2025 |
1167.80 (-0.66%) |
1175.00 |
1166.10 - 1175.00 |
0.657 times |
Tue 14 October 2025 |
1175.50 (1.04%) |
1163.40 |
1163.10 - 1181.00 |
0.8263 times |
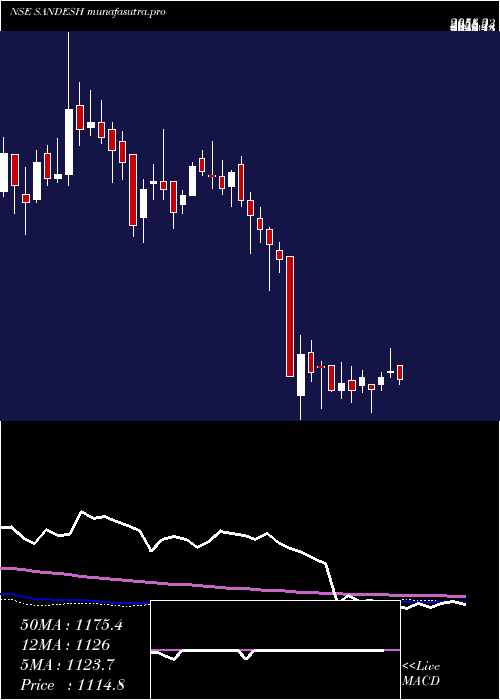
Weekly price and charts Sandesh Strong weekly Stock price targets for Sandesh SANDESH are 1143.2 and 1176.5 | Weekly Target 1 | 1136.43 | | Weekly Target 2 | 1149.97 | | Weekly Target 3 | 1169.7333333333 | | Weekly Target 4 | 1183.27 | | Weekly Target 5 | 1203.03 |
Weekly price and volumes for Sandesh
| Date |
Closing |
Open |
Range |
Volume |
Wed 29 October 2025 |
1163.50 (-0.87%) |
1168.00 |
1156.20 - 1189.50 |
0.4472 times |
Fri 24 October 2025 |
1173.70 (1.65%) |
1154.60 |
1131.90 - 1185.00 |
0.6525 times |
Fri 17 October 2025 |
1154.60 (-1.32%) |
1172.10 |
1130.10 - 1185.90 |
1.1764 times |
Fri 10 October 2025 |
1170.00 (0.86%) |
1160.10 |
1152.00 - 1197.80 |
0.6409 times |
Fri 03 October 2025 |
1160.00 (-1.16%) |
1170.10 |
1150.10 - 1189.90 |
0.7729 times |
Fri 26 September 2025 |
1173.60 (-2.14%) |
1176.10 |
1161.00 - 1239.90 |
0.8366 times |
Fri 19 September 2025 |
1199.30 (-0.29%) |
1204.40 |
1179.40 - 1216.60 |
0.7255 times |
Fri 12 September 2025 |
1202.80 (-1.8%) |
1224.90 |
1178.10 - 1234.20 |
1.5149 times |
Fri 05 September 2025 |
1224.90 (3.89%) |
1170.70 |
1161.20 - 1304.30 |
2.2025 times |
Fri 29 August 2025 |
1179.00 (-5.74%) |
1252.40 |
1165.00 - 1252.40 |
1.0307 times |
Fri 22 August 2025 |
1250.80 (-1.89%) |
1296.30 |
1242.10 - 1296.30 |
1.2152 times |
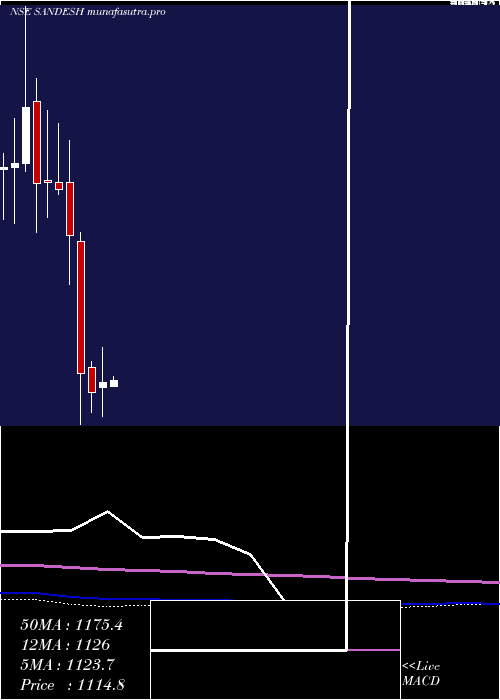
Monthly price and charts Sandesh Strong monthly Stock price targets for Sandesh SANDESH are 1112.95 and 1180.65 | Monthly Target 1 | 1096.1 | | Monthly Target 2 | 1129.8 | | Monthly Target 3 | 1163.8 | | Monthly Target 4 | 1197.5 | | Monthly Target 5 | 1231.5 |
Monthly price and volumes Sandesh
| Date |
Closing |
Open |
Range |
Volume |
Wed 29 October 2025 |
1163.50 (-1.1%) |
1174.60 |
1130.10 - 1197.80 |
0.3055 times |
Tue 30 September 2025 |
1176.50 (-0.21%) |
1170.70 |
1150.10 - 1304.30 |
0.516 times |
Fri 29 August 2025 |
1179.00 (0.8%) |
1169.80 |
1144.10 - 1438.50 |
3.9578 times |
Thu 31 July 2025 |
1169.60 (1.19%) |
1150.10 |
1130.00 - 1221.90 |
0.5065 times |
Mon 30 June 2025 |
1155.80 (-3.55%) |
1198.60 |
1118.10 - 1199.90 |
0.5065 times |
Fri 30 May 2025 |
1198.30 (7.95%) |
1100.00 |
1083.60 - 1248.00 |
0.4707 times |
Wed 30 April 2025 |
1110.00 (2.34%) |
1097.20 |
1024.05 - 1199.00 |
0.4857 times |
Fri 28 March 2025 |
1084.65 (-4.29%) |
1149.10 |
1035.05 - 1163.85 |
1.1784 times |
Fri 28 February 2025 |
1133.30 (-23.47%) |
1465.00 |
1005.00 - 1487.00 |
1.459 times |
Fri 31 January 2025 |
1480.95 (-7.18%) |
1615.00 |
1356.05 - 1720.00 |
0.6138 times |
Tue 31 December 2024 |
1595.55 (-1.19%) |
1614.70 |
1584.10 - 1762.45 |
0.7665 times |
DMA SMA EMA moving averages of Sandesh SANDESH
DMA (daily moving average) of Sandesh SANDESH
| DMA period | DMA value | | 5 day DMA | 1169.24 | | 12 day DMA | 1166.52 | | 20 day DMA | 1167.57 | | 35 day DMA | 1179.99 | | 50 day DMA | 1197.23 | | 100 day DMA | 1191.2 | | 150 day DMA | 1175.91 | | 200 day DMA | 1211.93 | EMA (exponential moving average) of Sandesh SANDESH
| EMA period | EMA current | EMA prev | EMA prev2 | | 5 day EMA | 1168.75 | 1171.37 | 1170.95 | | 12 day EMA | 1168.56 | 1169.48 | 1168.99 | | 20 day EMA | 1172.76 | 1173.73 | 1173.89 | | 35 day EMA | 1187.84 | 1189.27 | 1190.28 | | 50 day EMA | 1204.52 | 1206.19 | 1207.58 |
SMA (simple moving average) of Sandesh SANDESH
| SMA period | SMA current | SMA prev | SMA prev2 | | 5 day SMA | 1169.24 | 1170.58 | 1166.16 | | 12 day SMA | 1166.52 | 1167.06 | 1165.86 | | 20 day SMA | 1167.57 | 1167.59 | 1167.66 | | 35 day SMA | 1179.99 | 1181.01 | 1182.52 | | 50 day SMA | 1197.23 | 1199.46 | 1201.52 | | 100 day SMA | 1191.2 | 1190.94 | 1190.76 | | 150 day SMA | 1175.91 | 1175.53 | 1175.35 | | 200 day SMA | 1211.93 | 1214.33 | 1216.63 |
|
|
