SahajSolar SAHAJSOLAR_SM full analysis,charts,indicators,moving averages,SMA,DMA,EMA,ADX,MACD,RSISahaj Solar SAHAJSOLAR_SM WideScreen charts, DMA,SMA,EMA technical analysis, forecast prediction, by indicators ADX,MACD,RSI,CCI NSE stock exchange
Daily price and charts and targets SahajSolar Strong Daily Stock price targets for SahajSolar SAHAJSOLAR_SM are 210.83 and 218.08 | Daily Target 1 | 209.37 | | Daily Target 2 | 212.28 | | Daily Target 3 | 216.61666666667 | | Daily Target 4 | 219.53 | | Daily Target 5 | 223.87 |
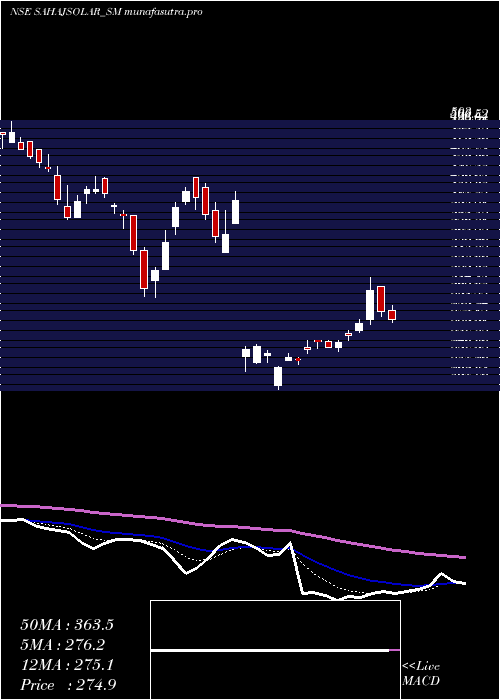
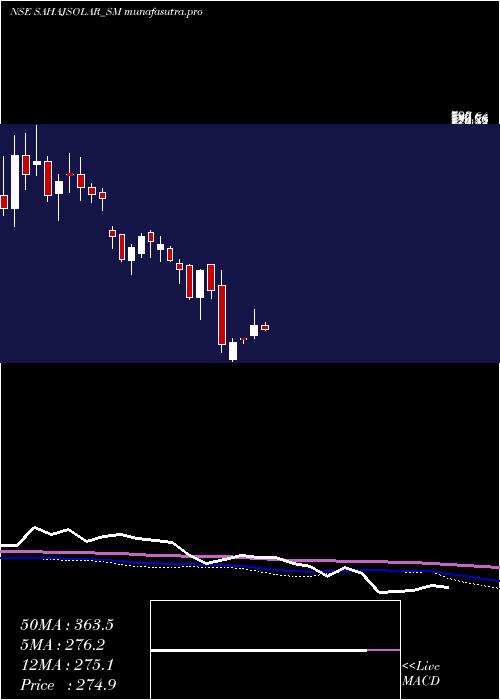
Daily price and volume Sahaj Solar
| Date |
Closing |
Open |
Range |
Volume |
Wed 29 October 2025 |
215.20 (-1.33%) |
216.05 |
213.70 - 220.95 |
1.4159 times |
Tue 28 October 2025 |
218.10 (0.11%) |
219.50 |
218.00 - 224.85 |
0.6785 times |
Mon 27 October 2025 |
217.85 (-2.46%) |
221.95 |
215.25 - 222.95 |
1.1209 times |
Fri 24 October 2025 |
223.35 (-0.82%) |
221.05 |
221.05 - 225.90 |
0.6195 times |
Thu 23 October 2025 |
225.20 (1.74%) |
220.50 |
220.50 - 226.70 |
1.2684 times |
Tue 21 October 2025 |
221.35 (-1.25%) |
224.00 |
219.00 - 225.00 |
0.472 times |
Mon 20 October 2025 |
224.15 (0.92%) |
223.05 |
219.05 - 226.90 |
1.3569 times |
Fri 17 October 2025 |
222.10 (0.95%) |
218.30 |
218.30 - 223.50 |
1.1209 times |
Thu 16 October 2025 |
220.00 (-0.9%) |
222.50 |
219.50 - 223.00 |
0.7375 times |
Wed 15 October 2025 |
222.00 (-0.2%) |
221.50 |
217.75 - 223.85 |
1.2094 times |
Tue 14 October 2025 |
222.45 (-1.98%) |
225.00 |
218.00 - 225.00 |
2.4484 times |
Weekly price and charts SahajSolar Strong weekly Stock price targets for SahajSolar SAHAJSOLAR_SM are 208.88 and 220.03 | Weekly Target 1 | 206.77 | | Weekly Target 2 | 210.98 | | Weekly Target 3 | 217.91666666667 | | Weekly Target 4 | 222.13 | | Weekly Target 5 | 229.07 |
Weekly price and volumes for Sahaj Solar
| Date |
Closing |
Open |
Range |
Volume |
Wed 29 October 2025 |
215.20 (-3.65%) |
221.95 |
213.70 - 224.85 |
0.4564 times |
Fri 24 October 2025 |
223.35 (0.56%) |
223.05 |
219.00 - 226.90 |
0.5276 times |
Fri 17 October 2025 |
222.10 (-1.31%) |
229.00 |
217.75 - 229.00 |
0.9003 times |
Fri 10 October 2025 |
225.05 (-2.05%) |
226.55 |
219.00 - 232.50 |
0.9255 times |
Fri 03 October 2025 |
229.75 (0.64%) |
250.00 |
227.55 - 250.00 |
1.1893 times |
Fri 26 September 2025 |
228.30 (-3.22%) |
235.00 |
227.00 - 240.05 |
1.0762 times |
Fri 19 September 2025 |
235.90 (-6.39%) |
252.00 |
230.10 - 252.50 |
1.3442 times |
Fri 12 September 2025 |
252.00 (-0.41%) |
253.05 |
245.00 - 265.00 |
0.9171 times |
Fri 05 September 2025 |
253.05 (2.37%) |
245.05 |
242.00 - 266.15 |
1.8049 times |
Fri 29 August 2025 |
247.20 (-5.65%) |
268.00 |
242.10 - 268.00 |
0.8585 times |
Fri 22 August 2025 |
262.00 (11.61%) |
236.25 |
233.00 - 265.00 |
2.1022 times |
Monthly price and charts SahajSolar Strong monthly Stock price targets for SahajSolar SAHAJSOLAR_SM are 203.85 and 225.05 | Monthly Target 1 | 200.07 | | Monthly Target 2 | 207.63 | | Monthly Target 3 | 221.26666666667 | | Monthly Target 4 | 228.83 | | Monthly Target 5 | 242.47 |
Monthly price and volumes Sahaj Solar
| Date |
Closing |
Open |
Range |
Volume |
Wed 29 October 2025 |
215.20 (-7.99%) |
234.90 |
213.70 - 234.90 |
0.223 times |
Tue 30 September 2025 |
233.90 (-5.38%) |
245.05 |
227.00 - 266.15 |
0.42 times |
Fri 29 August 2025 |
247.20 (-10.08%) |
248.85 |
230.00 - 268.00 |
0.417 times |
Mon 28 April 2025 |
274.90 (-26.15%) |
384.90 |
194.00 - 421.95 |
2.1855 times |
Fri 28 March 2025 |
372.25 (-16.95%) |
440.00 |
300.00 - 451.00 |
0.5701 times |
Fri 28 February 2025 |
448.25 (-7.08%) |
466.00 |
445.00 - 525.00 |
0.1829 times |
Fri 31 January 2025 |
482.40 (-20.39%) |
525.00 |
412.00 - 534.95 |
0.2012 times |
Tue 08 October 2024 |
605.95 (-5.49%) |
635.10 |
575.00 - 640.00 |
0.2704 times |
Mon 30 September 2024 |
641.15 (-8.4%) |
700.00 |
550.00 - 720.00 |
1.3513 times |
Fri 30 August 2024 |
699.95 (0%) |
449.00 |
442.00 - 790.00 |
4.1787 times |
Wed 29 October 2025 |
(0%) |
|
- |
0 times |

DMA SMA EMA moving averages of Sahaj Solar SAHAJSOLAR_SM
DMA (daily moving average) of Sahaj Solar SAHAJSOLAR_SM
| DMA period | DMA value | | 5 day DMA | 219.94 | | 12 day DMA | 221.56 | | 20 day DMA | 223.88 | | 35 day DMA | 231.2 | | 50 day DMA | 237.66 | | 100 day DMA | 285.22 | | 150 day DMA | 374.55 | | 200 day DMA | | EMA (exponential moving average) of Sahaj Solar SAHAJSOLAR_SM
| EMA period | EMA current | EMA prev | EMA prev2 | | 5 day EMA | 218.65 | 220.38 | 221.52 | | 12 day EMA | 221.45 | 222.59 | 223.41 | | 20 day EMA | 224.37 | 225.34 | 226.1 | | 35 day EMA | 229.89 | 230.76 | 231.51 | | 50 day EMA | 235.73 | 236.57 | 237.32 |
SMA (simple moving average) of Sahaj Solar SAHAJSOLAR_SM
| SMA period | SMA current | SMA prev | SMA prev2 | | 5 day SMA | 219.94 | 221.17 | 222.38 | | 12 day SMA | 221.56 | 222.38 | 222.75 | | 20 day SMA | 223.88 | 224.91 | 225.42 | | 35 day SMA | 231.2 | 232.39 | 233.39 | | 50 day SMA | 237.66 | 238.05 | 238.44 | | 100 day SMA | 285.22 | 287.96 | 290.46 | | 150 day SMA | 374.55 | 377.6 | 380.69 | | 200 day SMA |
|
|
