SafariInd SAFARI full analysis,charts,indicators,moving averages,SMA,DMA,EMA,ADX,MACD,RSISafari Ind SAFARI WideScreen charts, DMA,SMA,EMA technical analysis, forecast prediction, by indicators ADX,MACD,RSI,CCI NSE stock exchange
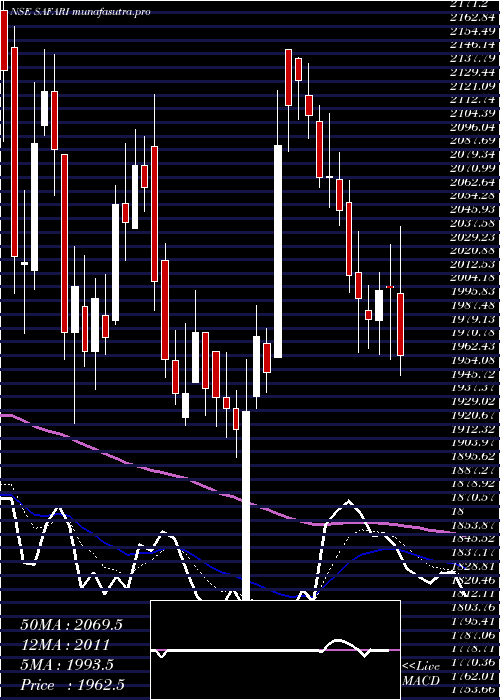
Daily price and charts and targets SafariInd Strong Daily Stock price targets for SafariInd SAFARI are 2092.7 and 2147.6 | Daily Target 1 | 2080.17 | | Daily Target 2 | 2105.23 | | Daily Target 3 | 2135.0666666667 | | Daily Target 4 | 2160.13 | | Daily Target 5 | 2189.97 |
Daily price and volume Safari Ind
| Date |
Closing |
Open |
Range |
Volume |
Tue 28 October 2025 |
2130.30 (-0.93%) |
2150.50 |
2110.00 - 2164.90 |
1.4942 times |
Mon 27 October 2025 |
2150.30 (1.52%) |
2118.10 |
2102.20 - 2155.00 |
1.1778 times |
Fri 24 October 2025 |
2118.10 (1.71%) |
2081.00 |
2052.10 - 2129.80 |
1.8542 times |
Thu 23 October 2025 |
2082.50 (-1.66%) |
2112.00 |
2080.00 - 2125.10 |
0.8415 times |
Tue 21 October 2025 |
2117.60 (0.72%) |
2125.40 |
2104.40 - 2127.70 |
0.1151 times |
Mon 20 October 2025 |
2102.40 (-2.6%) |
2160.10 |
2092.00 - 2187.50 |
1.0379 times |
Fri 17 October 2025 |
2158.60 (-2.01%) |
2202.90 |
2150.10 - 2208.90 |
0.6816 times |
Thu 16 October 2025 |
2202.90 (-0.88%) |
2202.40 |
2190.00 - 2225.50 |
0.4666 times |
Wed 15 October 2025 |
2222.40 (1.78%) |
2165.50 |
2165.00 - 2248.90 |
1.6642 times |
Tue 14 October 2025 |
2183.60 (-1.07%) |
2182.20 |
2168.10 - 2215.00 |
0.6669 times |
Mon 13 October 2025 |
2207.20 (-1.31%) |
2236.10 |
2192.50 - 2236.10 |
0.9528 times |
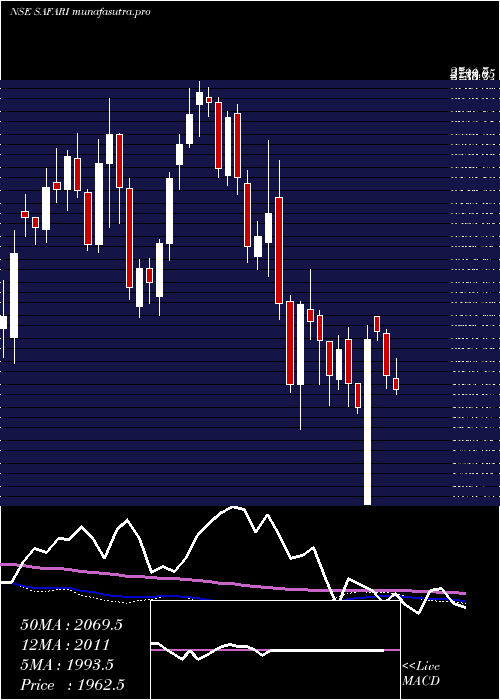
Weekly price and charts SafariInd Strong weekly Stock price targets for SafariInd SAFARI are 2116.25 and 2178.95 | Weekly Target 1 | 2069.77 | | Weekly Target 2 | 2100.03 | | Weekly Target 3 | 2132.4666666667 | | Weekly Target 4 | 2162.73 | | Weekly Target 5 | 2195.17 |
Weekly price and volumes for Safari Ind
| Date |
Closing |
Open |
Range |
Volume |
Tue 28 October 2025 |
2130.30 (0.58%) |
2118.10 |
2102.20 - 2164.90 |
0.2457 times |
Fri 24 October 2025 |
2118.10 (-1.88%) |
2160.10 |
2052.10 - 2187.50 |
0.3539 times |
Fri 17 October 2025 |
2158.60 (-3.48%) |
2236.10 |
2150.10 - 2248.90 |
0.4075 times |
Fri 10 October 2025 |
2236.40 (2.88%) |
2173.90 |
2170.00 - 2291.90 |
0.5769 times |
Fri 03 October 2025 |
2173.90 (-0.79%) |
2191.20 |
2158.00 - 2220.50 |
0.3507 times |
Fri 26 September 2025 |
2191.20 (-3.6%) |
2270.00 |
2164.20 - 2270.00 |
0.4477 times |
Fri 19 September 2025 |
2273.00 (0.62%) |
2263.00 |
2223.60 - 2299.40 |
0.8042 times |
Fri 12 September 2025 |
2259.00 (5.25%) |
2173.00 |
2115.00 - 2290.00 |
1.3448 times |
Fri 05 September 2025 |
2146.30 (0.15%) |
2149.90 |
2097.10 - 2236.40 |
2.3825 times |
Fri 29 August 2025 |
2143.10 (6.42%) |
2016.70 |
2016.70 - 2267.00 |
3.0861 times |
Fri 22 August 2025 |
2013.90 (-1.99%) |
2070.10 |
2000.00 - 2085.20 |
2.1204 times |
Monthly price and charts SafariInd Strong monthly Stock price targets for SafariInd SAFARI are 1971.3 and 2211.1 | Monthly Target 1 | 1918.3 | | Monthly Target 2 | 2024.3 | | Monthly Target 3 | 2158.1 | | Monthly Target 4 | 2264.1 | | Monthly Target 5 | 2397.9 |
Monthly price and volumes Safari Ind
| Date |
Closing |
Open |
Range |
Volume |
Tue 28 October 2025 |
2130.30 (-2.65%) |
2188.00 |
2052.10 - 2291.90 |
0.2922 times |
Tue 30 September 2025 |
2188.30 (2.11%) |
2149.90 |
2097.10 - 2299.40 |
0.8996 times |
Fri 29 August 2025 |
2143.10 (2.14%) |
2073.50 |
2000.00 - 2267.00 |
1.3251 times |
Thu 31 July 2025 |
2098.20 (-2.77%) |
2152.00 |
1992.10 - 2255.40 |
0.4236 times |
Mon 30 June 2025 |
2158.00 (-6.49%) |
2341.00 |
2101.00 - 2341.00 |
0.9917 times |
Fri 30 May 2025 |
2307.70 (15.15%) |
2000.00 |
1875.90 - 2326.20 |
0.8832 times |
Wed 30 April 2025 |
2004.10 (1.4%) |
1976.50 |
1670.15 - 2149.00 |
0.8104 times |
Fri 28 March 2025 |
1976.50 (-7.47%) |
2150.00 |
1920.00 - 2163.00 |
0.5887 times |
Fri 28 February 2025 |
2136.05 (-11.37%) |
2450.00 |
1861.55 - 2543.95 |
2.1414 times |
Fri 31 January 2025 |
2410.00 (-7.37%) |
2613.45 |
2248.25 - 2686.30 |
1.6441 times |
Tue 31 December 2024 |
2601.75 (0.64%) |
2586.00 |
2480.00 - 2744.70 |
0.8353 times |
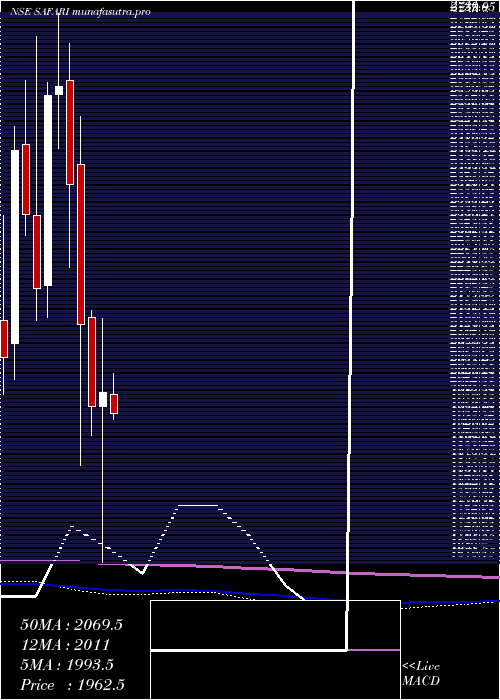
DMA SMA EMA moving averages of Safari Ind SAFARI
DMA (daily moving average) of Safari Ind SAFARI
| DMA period | DMA value | | 5 day DMA | 2119.76 | | 12 day DMA | 2159.36 | | 20 day DMA | 2177.73 | | 35 day DMA | 2199.6 | | 50 day DMA | 2169.02 | | 100 day DMA | 2156.18 | | 150 day DMA | 2137.62 | | 200 day DMA | 2156.11 | EMA (exponential moving average) of Safari Ind SAFARI
| EMA period | EMA current | EMA prev | EMA prev2 | | 5 day EMA | 2131.69 | 2132.39 | 2123.43 | | 12 day EMA | 2151.32 | 2155.14 | 2156.02 | | 20 day EMA | 2164.69 | 2168.31 | 2170.21 | | 35 day EMA | 2160.53 | 2162.31 | 2163.02 | | 50 day EMA | 2153.64 | 2154.59 | 2154.76 |
SMA (simple moving average) of Safari Ind SAFARI
| SMA period | SMA current | SMA prev | SMA prev2 | | 5 day SMA | 2119.76 | 2114.18 | 2115.84 | | 12 day SMA | 2159.36 | 2170.87 | 2179.89 | | 20 day SMA | 2177.73 | 2180.77 | 2184.14 | | 35 day SMA | 2199.6 | 2200.06 | 2200.15 | | 50 day SMA | 2169.02 | 2167.33 | 2164.76 | | 100 day SMA | 2156.18 | 2157.38 | 2158.82 | | 150 day SMA | 2137.62 | 2137.04 | 2136.4 | | 200 day SMA | 2156.11 | 2158.46 | 2160.97 |
|
|
