SabEvents SABEVENTS_BE full analysis,charts,indicators,moving averages,SMA,DMA,EMA,ADX,MACD,RSISab Events SABEVENTS_BE WideScreen charts, DMA,SMA,EMA technical analysis, forecast prediction, by indicators ADX,MACD,RSI,CCI NSE stock exchange
Daily price and charts and targets SabEvents Strong Daily Stock price targets for SabEvents SABEVENTS_BE are 6.06 and 6.15 | Daily Target 1 | 5.98 | | Daily Target 2 | 6.04 | | Daily Target 3 | 6.07 | | Daily Target 4 | 6.13 | | Daily Target 5 | 6.16 |
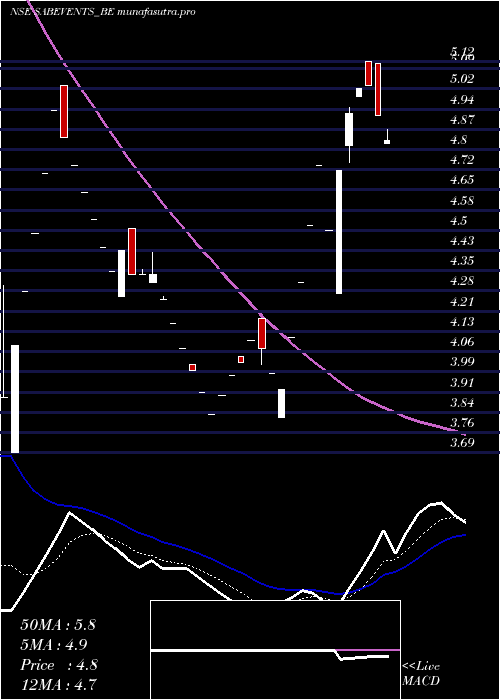
Daily price and volume Sab Events
| Date |
Closing |
Open |
Range |
Volume |
Mon 27 October 2025 |
6.10 (1.5%) |
6.01 |
6.01 - 6.10 |
0.4521 times |
Fri 24 October 2025 |
6.01 (0.33%) |
6.01 |
6.01 - 6.01 |
0.4456 times |
Thu 23 October 2025 |
5.99 (0.17%) |
5.86 |
5.86 - 5.99 |
0.3904 times |
Tue 21 October 2025 |
5.98 (0%) |
5.98 |
5.98 - 5.98 |
0.0121 times |
Mon 20 October 2025 |
5.98 (1.87%) |
5.98 |
5.98 - 5.98 |
2.2244 times |
Fri 17 October 2025 |
5.87 (0.34%) |
5.86 |
5.86 - 5.87 |
0.5459 times |
Thu 16 October 2025 |
5.85 (0.17%) |
5.85 |
5.84 - 5.86 |
1.0196 times |
Wed 15 October 2025 |
5.84 (1.92%) |
5.73 |
5.73 - 5.84 |
2.0072 times |
Tue 14 October 2025 |
5.73 (-2.05%) |
5.85 |
5.73 - 5.85 |
2.3473 times |
Mon 13 October 2025 |
5.85 (0.34%) |
5.83 |
5.83 - 5.85 |
0.5555 times |
Fri 10 October 2025 |
5.83 (-2.02%) |
5.95 |
5.83 - 5.95 |
1.539 times |
Weekly price and charts SabEvents Strong weekly Stock price targets for SabEvents SABEVENTS_BE are 6.06 and 6.15 | Weekly Target 1 | 5.98 | | Weekly Target 2 | 6.04 | | Weekly Target 3 | 6.07 | | Weekly Target 4 | 6.13 | | Weekly Target 5 | 6.16 |
Weekly price and volumes for Sab Events
| Date |
Closing |
Open |
Range |
Volume |
Mon 27 October 2025 |
6.10 (1.5%) |
6.01 |
6.01 - 6.10 |
0.062 times |
Fri 24 October 2025 |
6.01 (2.39%) |
5.98 |
5.86 - 6.01 |
0.4216 times |
Fri 17 October 2025 |
5.87 (0.69%) |
5.83 |
5.73 - 5.87 |
0.8886 times |
Fri 10 October 2025 |
5.83 (-9.89%) |
6.34 |
5.83 - 6.34 |
1.2296 times |
Fri 03 October 2025 |
6.47 (-7.7%) |
6.86 |
6.47 - 6.92 |
0.3641 times |
Fri 26 September 2025 |
7.01 (7.52%) |
6.70 |
6.51 - 7.48 |
1.4979 times |
Fri 19 September 2025 |
6.52 (7.77%) |
6.05 |
5.75 - 6.74 |
1.25 times |
Fri 12 September 2025 |
6.05 (-3.35%) |
6.39 |
5.72 - 6.39 |
2.0173 times |
Fri 05 September 2025 |
6.26 (4.68%) |
6.27 |
5.99 - 6.55 |
1.9022 times |
Fri 29 August 2025 |
5.98 (-0.33%) |
6.00 |
5.76 - 6.00 |
0.3666 times |
Fri 22 August 2025 |
6.00 (5.08%) |
5.71 |
5.69 - 6.00 |
1.097 times |

Monthly price and charts SabEvents Strong monthly Stock price targets for SabEvents SABEVENTS_BE are 5.48 and 6.36 | Monthly Target 1 | 5.27 | | Monthly Target 2 | 5.68 | | Monthly Target 3 | 6.1466666666667 | | Monthly Target 4 | 6.56 | | Monthly Target 5 | 7.03 |
Monthly price and volumes Sab Events
| Date |
Closing |
Open |
Range |
Volume |
Mon 27 October 2025 |
6.10 (-9.63%) |
6.61 |
5.73 - 6.61 |
0.2172 times |
Tue 30 September 2025 |
6.75 (12.88%) |
6.27 |
5.72 - 7.48 |
0.5422 times |
Fri 29 August 2025 |
5.98 (-9.53%) |
6.47 |
5.63 - 6.47 |
0.2362 times |
Thu 31 July 2025 |
6.61 (5.09%) |
6.29 |
5.92 - 7.79 |
1.0027 times |
Mon 30 June 2025 |
6.29 (9.97%) |
5.79 |
5.30 - 6.56 |
1.3215 times |
Fri 30 May 2025 |
5.72 (4.19%) |
5.59 |
4.87 - 6.20 |
0.8492 times |
Wed 30 April 2025 |
5.49 (40.05%) |
4.11 |
4.11 - 5.49 |
0.3218 times |
Fri 28 March 2025 |
3.92 (-11.71%) |
4.35 |
3.82 - 4.51 |
0.7113 times |
Fri 28 February 2025 |
4.44 (-32.21%) |
5.90 |
3.69 - 6.19 |
3.9771 times |
Fri 31 January 2025 |
6.55 (-61.04%) |
16.47 |
6.55 - 16.47 |
0.8208 times |
Tue 31 December 2024 |
16.81 (-8.74%) |
19.34 |
16.81 - 22.83 |
0.1949 times |

DMA SMA EMA moving averages of Sab Events SABEVENTS_BE
DMA (daily moving average) of Sab Events SABEVENTS_BE
| DMA period | DMA value | | 5 day DMA | 6.01 | | 12 day DMA | 5.92 | | 20 day DMA | 6.17 | | 35 day DMA | 6.27 | | 50 day DMA | 6.19 | | 100 day DMA | 6.27 | | 150 day DMA | 5.84 | | 200 day DMA | 6.28 | EMA (exponential moving average) of Sab Events SABEVENTS_BE
| EMA period | EMA current | EMA prev | EMA prev2 | | 5 day EMA | 6.01 | 5.97 | 5.95 | | 12 day EMA | 6.03 | 6.02 | 6.02 | | 20 day EMA | 6.1 | 6.1 | 6.11 | | 35 day EMA | 6.1 | 6.1 | 6.11 | | 50 day EMA | 6.14 | 6.14 | 6.15 |
SMA (simple moving average) of Sab Events SABEVENTS_BE
| SMA period | SMA current | SMA prev | SMA prev2 | | 5 day SMA | 6.01 | 5.97 | 5.93 | | 12 day SMA | 5.92 | 5.91 | 5.93 | | 20 day SMA | 6.17 | 6.22 | 6.28 | | 35 day SMA | 6.27 | 6.28 | 6.29 | | 50 day SMA | 6.19 | 6.18 | 6.18 | | 100 day SMA | 6.27 | 6.26 | 6.26 | | 150 day SMA | 5.84 | 5.83 | 5.82 | | 200 day SMA | 6.28 | 6.33 | 6.38 |
|
|
