RavinderHeights RVHL_BE full analysis,charts,indicators,moving averages,SMA,DMA,EMA,ADX,MACD,RSIRavinder Heights RVHL_BE WideScreen charts, DMA,SMA,EMA technical analysis, forecast prediction, by indicators ADX,MACD,RSI,CCI NSE stock exchange
Daily price and charts and targets RavinderHeights Strong Daily Stock price targets for RavinderHeights RVHL_BE are 55.03 and 55.87 | Daily Target 1 | 54.89 | | Daily Target 2 | 55.17 | | Daily Target 3 | 55.73 | | Daily Target 4 | 56.01 | | Daily Target 5 | 56.57 |
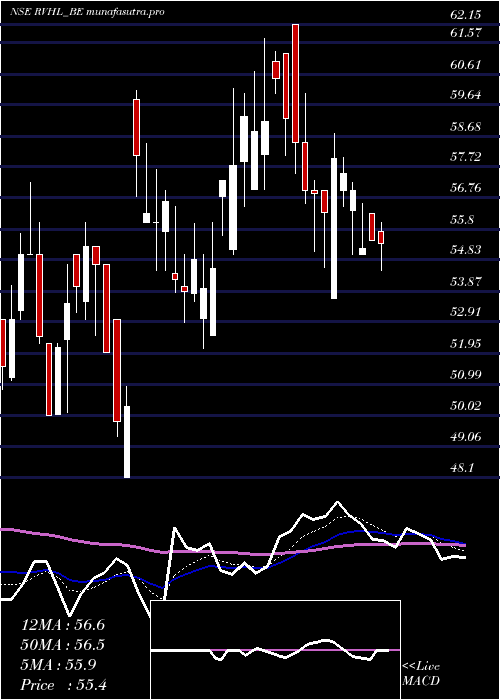
Daily price and volume Ravinder Heights
| Date |
Closing |
Open |
Range |
Volume |
Tue 28 October 2025 |
55.45 (0.49%) |
56.29 |
55.45 - 56.29 |
0.4109 times |
Mon 27 October 2025 |
55.18 (-3.19%) |
55.02 |
55.01 - 56.60 |
1.2608 times |
Fri 24 October 2025 |
57.00 (-0.92%) |
56.38 |
55.01 - 57.25 |
0.7965 times |
Thu 23 October 2025 |
57.53 (-0.79%) |
57.00 |
56.50 - 58.00 |
0.4336 times |
Tue 21 October 2025 |
57.99 (2.97%) |
53.65 |
53.65 - 58.75 |
0.3745 times |
Mon 20 October 2025 |
56.32 (-1.04%) |
57.00 |
54.61 - 57.00 |
1.7379 times |
Fri 17 October 2025 |
56.91 (-0.12%) |
56.98 |
55.10 - 57.30 |
1.6828 times |
Thu 16 October 2025 |
56.98 (-2.56%) |
58.48 |
56.60 - 60.00 |
1.803 times |
Wed 15 October 2025 |
58.48 (-1.27%) |
62.15 |
57.52 - 62.15 |
0.7743 times |
Tue 14 October 2025 |
59.23 (-2.05%) |
61.24 |
58.07 - 61.24 |
0.7257 times |
Mon 13 October 2025 |
60.47 (2.28%) |
60.98 |
60.00 - 61.30 |
5.7877 times |
Weekly price and charts RavinderHeights Strong weekly Stock price targets for RavinderHeights RVHL_BE are 55.23 and 56.82 | Weekly Target 1 | 54.1 | | Weekly Target 2 | 54.77 | | Weekly Target 3 | 55.686666666667 | | Weekly Target 4 | 56.36 | | Weekly Target 5 | 57.28 |
Weekly price and volumes for Ravinder Heights
| Date |
Closing |
Open |
Range |
Volume |
Tue 28 October 2025 |
55.45 (-2.72%) |
55.02 |
55.01 - 56.60 |
0.2464 times |
Fri 24 October 2025 |
57.00 (0.16%) |
57.00 |
53.65 - 58.75 |
0.4927 times |
Fri 17 October 2025 |
56.91 (-3.74%) |
60.98 |
55.10 - 62.15 |
1.5879 times |
Fri 10 October 2025 |
59.12 (8.32%) |
56.80 |
55.00 - 61.70 |
3.78 times |
Fri 03 October 2025 |
54.58 (0.66%) |
54.00 |
52.09 - 56.00 |
0.4353 times |
Fri 26 September 2025 |
54.22 (7.81%) |
59.81 |
53.82 - 60.10 |
0.944 times |
Mon 24 March 2025 |
50.29 (0.94%) |
48.10 |
48.10 - 50.90 |
0.0855 times |
Fri 21 March 2025 |
49.82 (-6.86%) |
55.00 |
49.35 - 56.00 |
1.7958 times |
Thu 13 March 2025 |
53.49 (-2.75%) |
55.00 |
50.00 - 56.00 |
0.3273 times |
Fri 07 March 2025 |
55.00 (2.06%) |
54.50 |
50.82 - 57.25 |
0.3052 times |
Fri 28 February 2025 |
53.89 (-2.12%) |
52.35 |
51.56 - 57.00 |
0.4317 times |

Monthly price and charts RavinderHeights Strong monthly Stock price targets for RavinderHeights RVHL_BE are 53.77 and 63.83 | Monthly Target 1 | 46.5 | | Monthly Target 2 | 50.98 | | Monthly Target 3 | 56.563333333333 | | Monthly Target 4 | 61.04 | | Monthly Target 5 | 66.62 |
Monthly price and volumes Ravinder Heights
| Date |
Closing |
Open |
Range |
Volume |
Tue 28 October 2025 |
55.45 (1.11%) |
53.01 |
52.09 - 62.15 |
1.8202 times |
Tue 30 September 2025 |
54.84 (9.05%) |
59.81 |
52.90 - 60.10 |
0.3602 times |
Mon 24 March 2025 |
50.29 (-6.68%) |
54.50 |
48.10 - 57.25 |
0.7321 times |
Fri 28 February 2025 |
53.89 (-4.23%) |
58.70 |
50.00 - 62.00 |
0.5105 times |
Fri 31 January 2025 |
56.27 (-22.18%) |
72.32 |
56.00 - 75.99 |
0.6207 times |
Tue 31 December 2024 |
72.31 (24.69%) |
71.10 |
68.81 - 72.39 |
0.0548 times |
Mon 07 October 2024 |
57.99 (-7.57%) |
62.99 |
57.00 - 63.00 |
0.2663 times |
Mon 30 September 2024 |
62.74 (14.18%) |
62.25 |
58.01 - 69.00 |
3.1208 times |
Fri 24 May 2024 |
54.95 (27.2%) |
42.75 |
42.40 - 55.00 |
1.8579 times |
Tue 30 April 2024 |
43.20 (8%) |
39.00 |
39.00 - 51.00 |
0.6565 times |
Thu 28 March 2024 |
40.00 (-11.01%) |
44.15 |
38.00 - 50.25 |
3.1423 times |

DMA SMA EMA moving averages of Ravinder Heights RVHL_BE
DMA (daily moving average) of Ravinder Heights RVHL_BE
| DMA period | DMA value | | 5 day DMA | 56.63 | | 12 day DMA | 57.56 | | 20 day DMA | 57.05 | | 35 day DMA | 55.61 | | 50 day DMA | 55.06 | | 100 day DMA | 59.51 | | 150 day DMA | 55.48 | | 200 day DMA | 53.3 | EMA (exponential moving average) of Ravinder Heights RVHL_BE
| EMA period | EMA current | EMA prev | EMA prev2 | | 5 day EMA | 56.24 | 56.63 | 57.36 | | 12 day EMA | 56.8 | 57.05 | 57.39 | | 20 day EMA | 56.66 | 56.79 | 56.96 | | 35 day EMA | 56.07 | 56.11 | 56.17 | | 50 day EMA | 55.19 | 55.18 | 55.18 |
SMA (simple moving average) of Ravinder Heights RVHL_BE
| SMA period | SMA current | SMA prev | SMA prev2 | | 5 day SMA | 56.63 | 56.8 | 57.15 | | 12 day SMA | 57.56 | 57.84 | 58.18 | | 20 day SMA | 57.05 | 56.99 | 57.07 | | 35 day SMA | 55.61 | 55.6 | 55.59 | | 50 day SMA | 55.06 | 55.05 | 55.01 | | 100 day SMA | 59.51 | 59.57 | 59.65 | | 150 day SMA | 55.48 | 55.38 | 55.3 | | 200 day SMA | 53.3 | 53.19 | 53.09 |
|
|
