RavinderHeights RVHL full analysis,charts,indicators,moving averages,SMA,DMA,EMA,ADX,MACD,RSIRavinder Heights RVHL WideScreen charts, DMA,SMA,EMA technical analysis, forecast prediction, by indicators ADX,MACD,RSI,CCI NSE stock exchange
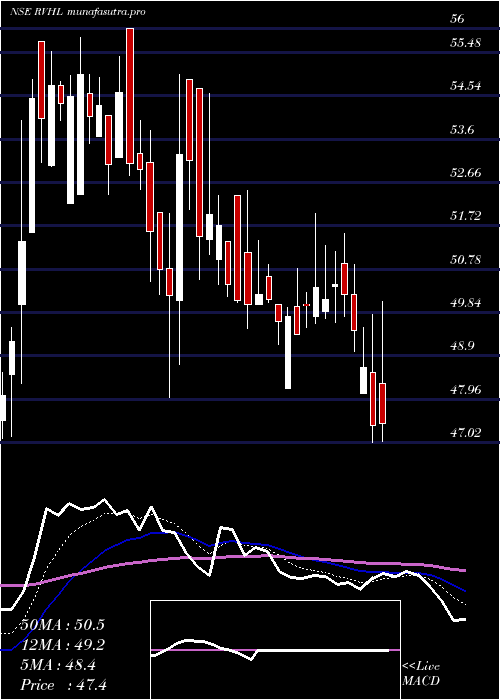
Daily price and charts and targets RavinderHeights Strong Daily Stock price targets for RavinderHeights RVHL are 40 and 43.09 | Daily Target 1 | 39.35 | | Daily Target 2 | 40.64 | | Daily Target 3 | 42.44 | | Daily Target 4 | 43.73 | | Daily Target 5 | 45.53 |
Daily price and volume Ravinder Heights
| Date |
Closing |
Open |
Range |
Volume |
Wed 30 July 2025 |
41.93 (-2.26%) |
43.00 |
41.15 - 44.24 |
0.5389 times |
Tue 29 July 2025 |
42.90 (0.09%) |
42.51 |
42.02 - 43.85 |
0.7742 times |
Mon 28 July 2025 |
42.86 (-5.66%) |
45.90 |
42.42 - 45.90 |
0.5754 times |
Fri 25 July 2025 |
45.43 (4.1%) |
43.22 |
42.91 - 46.00 |
0.4398 times |
Thu 24 July 2025 |
43.64 (-2.94%) |
45.60 |
43.01 - 45.60 |
0.7078 times |
Wed 23 July 2025 |
44.96 (2.02%) |
44.09 |
44.00 - 46.14 |
0.5025 times |
Tue 22 July 2025 |
44.07 (-0.59%) |
44.89 |
44.01 - 45.51 |
0.6111 times |
Mon 21 July 2025 |
44.33 (-1.86%) |
51.98 |
44.00 - 51.98 |
4.2534 times |
Fri 18 July 2025 |
45.17 (-1.38%) |
47.26 |
44.15 - 47.26 |
0.6393 times |
Thu 17 July 2025 |
45.80 (-2.66%) |
49.25 |
45.35 - 49.25 |
0.9577 times |
Wed 16 July 2025 |
47.05 (-0.82%) |
47.43 |
46.51 - 48.51 |
1.5041 times |
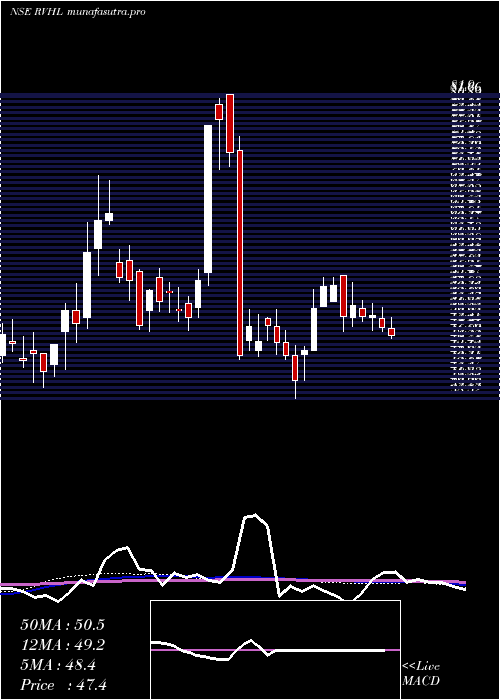
Weekly price and charts RavinderHeights Strong weekly Stock price targets for RavinderHeights RVHL are 39.17 and 43.92 | Weekly Target 1 | 38.24 | | Weekly Target 2 | 40.09 | | Weekly Target 3 | 42.993333333333 | | Weekly Target 4 | 44.84 | | Weekly Target 5 | 47.74 |
Weekly price and volumes for Ravinder Heights
| Date |
Closing |
Open |
Range |
Volume |
Wed 30 July 2025 |
41.93 (-7.7%) |
45.90 |
41.15 - 45.90 |
0.3582 times |
Fri 25 July 2025 |
45.43 (0.58%) |
51.98 |
42.91 - 51.98 |
1.2358 times |
Fri 18 July 2025 |
45.17 (-7.13%) |
48.54 |
44.15 - 50.08 |
1.0167 times |
Fri 11 July 2025 |
48.64 (-3.43%) |
49.87 |
48.07 - 51.55 |
0.7125 times |
Fri 04 July 2025 |
50.37 (0.48%) |
50.00 |
48.20 - 51.99 |
0.5024 times |
Fri 27 June 2025 |
50.13 (-3.07%) |
51.39 |
49.50 - 52.49 |
1.5937 times |
Fri 20 June 2025 |
51.72 (3.03%) |
50.10 |
48.71 - 55.00 |
1.1233 times |
Fri 13 June 2025 |
50.20 (-8.08%) |
56.00 |
48.00 - 56.00 |
1.3279 times |
Fri 06 June 2025 |
54.61 (0.17%) |
52.41 |
52.41 - 55.80 |
1.1949 times |
Fri 30 May 2025 |
54.52 (6.11%) |
51.57 |
51.57 - 55.72 |
0.9347 times |
Fri 23 May 2025 |
51.38 (13.37%) |
45.40 |
45.40 - 54.00 |
0.7021 times |
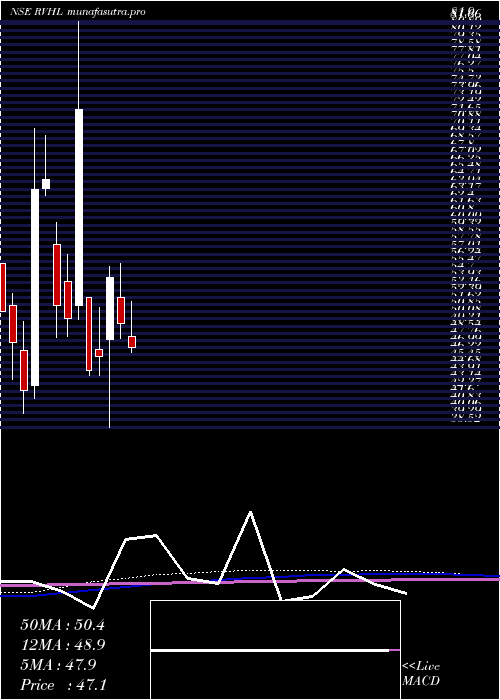
Monthly price and charts RavinderHeights Strong monthly Stock price targets for RavinderHeights RVHL are 36.12 and 46.96 | Monthly Target 1 | 34.18 | | Monthly Target 2 | 38.06 | | Monthly Target 3 | 45.023333333333 | | Monthly Target 4 | 48.9 | | Monthly Target 5 | 55.86 |
Monthly price and volumes Ravinder Heights
| Date |
Closing |
Open |
Range |
Volume |
Wed 30 July 2025 |
41.93 (-15.53%) |
48.20 |
41.15 - 51.99 |
0.4641 times |
Mon 30 June 2025 |
49.64 (-8.95%) |
52.41 |
48.00 - 56.00 |
0.6794 times |
Fri 30 May 2025 |
54.52 (18.26%) |
47.84 |
38.52 - 55.72 |
0.3281 times |
Wed 30 April 2025 |
46.10 (3.43%) |
46.78 |
44.00 - 51.25 |
0.1521 times |
Fri 28 March 2025 |
44.57 (-38.47%) |
52.38 |
43.99 - 52.38 |
0.0829 times |
Mon 30 December 2024 |
72.44 (44.59%) |
51.46 |
50.00 - 81.90 |
1.8254 times |
Fri 29 November 2024 |
50.10 (-2.74%) |
54.08 |
48.20 - 57.00 |
0.5374 times |
Thu 31 October 2024 |
51.51 (-20.73%) |
57.98 |
48.10 - 60.39 |
0.6183 times |
Wed 04 September 2024 |
64.98 (1.75%) |
64.00 |
63.30 - 69.70 |
0.5111 times |
Fri 30 August 2024 |
63.86 (50.47%) |
42.98 |
41.60 - 70.41 |
4.8013 times |
Wed 31 July 2024 |
42.44 (-10.82%) |
46.65 |
40.00 - 49.80 |
1.0316 times |
DMA SMA EMA moving averages of Ravinder Heights RVHL
DMA (daily moving average) of Ravinder Heights RVHL
| DMA period | DMA value | | 5 day DMA | 43.35 | | 12 day DMA | 44.63 | | 20 day DMA | 46.61 | | 35 day DMA | 48.41 | | 50 day DMA | 49.92 | | 100 day DMA | 51.94 | | 150 day DMA | 52.77 | | 200 day DMA | 51.33 | EMA (exponential moving average) of Ravinder Heights RVHL
| EMA period | EMA current | EMA prev | EMA prev2 | | 5 day EMA | 43.16 | 43.78 | 44.22 | | 12 day EMA | 44.64 | 45.13 | 45.53 | | 20 day EMA | 45.91 | 46.33 | 46.69 | | 35 day EMA | 47.5 | 47.83 | 48.12 | | 50 day EMA | 48.96 | 49.25 | 49.51 |
SMA (simple moving average) of Ravinder Heights RVHL
| SMA period | SMA current | SMA prev | SMA prev2 | | 5 day SMA | 43.35 | 43.96 | 44.19 | | 12 day SMA | 44.63 | 45.09 | 45.56 | | 20 day SMA | 46.61 | 46.98 | 47.32 | | 35 day SMA | 48.41 | 48.69 | 48.97 | | 50 day SMA | 49.92 | 50.04 | 50.13 | | 100 day SMA | 51.94 | 52.19 | 52.37 | | 150 day SMA | 52.77 | 52.89 | 52.99 | | 200 day SMA | 51.33 | 51.37 | 51.39 |
|
|
