KeystoneRealtors RUSTOMJEE full analysis,charts,indicators,moving averages,SMA,DMA,EMA,ADX,MACD,RSIKeystone Realtors RUSTOMJEE WideScreen charts, DMA,SMA,EMA technical analysis, forecast prediction, by indicators ADX,MACD,RSI,CCI NSE stock exchange
Daily price and charts and targets KeystoneRealtors Strong Daily Stock price targets for KeystoneRealtors RUSTOMJEE are 559.2 and 569.8 | Daily Target 1 | 556.92 | | Daily Target 2 | 561.48 | | Daily Target 3 | 567.51666666667 | | Daily Target 4 | 572.08 | | Daily Target 5 | 578.12 |
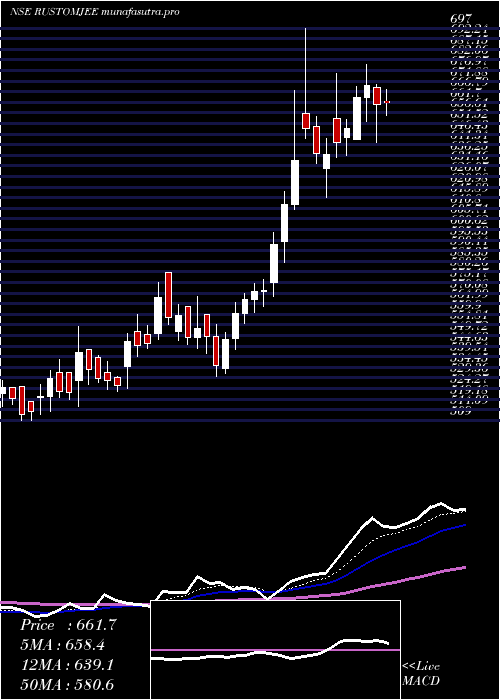
Daily price and volume Keystone Realtors
| Date |
Closing |
Open |
Range |
Volume |
Tue 28 October 2025 |
566.05 (-1.28%) |
573.40 |
562.95 - 573.55 |
0.0806 times |
Mon 27 October 2025 |
573.40 (-0.54%) |
579.90 |
569.50 - 581.40 |
0.3142 times |
Fri 24 October 2025 |
576.50 (1.67%) |
568.00 |
564.05 - 581.80 |
0.4894 times |
Thu 23 October 2025 |
567.05 (-1.25%) |
576.95 |
565.60 - 582.90 |
0.1839 times |
Tue 21 October 2025 |
574.25 (-1.01%) |
582.20 |
573.05 - 582.20 |
0.0457 times |
Mon 20 October 2025 |
580.10 (0.85%) |
579.00 |
567.80 - 582.35 |
0.5564 times |
Fri 17 October 2025 |
575.20 (0.22%) |
570.00 |
567.00 - 583.00 |
1.8671 times |
Thu 16 October 2025 |
573.95 (1.67%) |
560.00 |
557.00 - 583.70 |
4.108 times |
Wed 15 October 2025 |
564.50 (-7.83%) |
585.00 |
560.10 - 590.00 |
2.191 times |
Tue 14 October 2025 |
612.45 (0.02%) |
612.30 |
589.20 - 625.05 |
0.1637 times |
Mon 13 October 2025 |
612.30 (-1.15%) |
616.35 |
610.00 - 618.75 |
0.0297 times |
Weekly price and charts KeystoneRealtors Strong weekly Stock price targets for KeystoneRealtors RUSTOMJEE are 555.28 and 573.73 | Weekly Target 1 | 551.68 | | Weekly Target 2 | 558.87 | | Weekly Target 3 | 570.13333333333 | | Weekly Target 4 | 577.32 | | Weekly Target 5 | 588.58 |
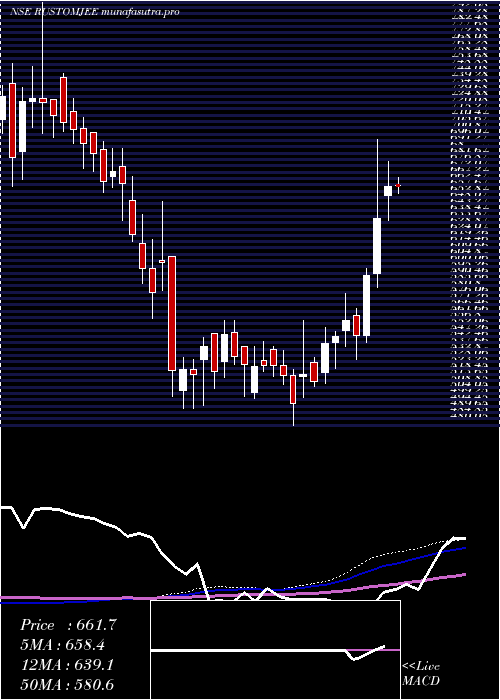
Weekly price and volumes for Keystone Realtors
| Date |
Closing |
Open |
Range |
Volume |
Tue 28 October 2025 |
566.05 (-1.81%) |
579.90 |
562.95 - 581.40 |
0.2915 times |
Fri 24 October 2025 |
576.50 (0.23%) |
579.00 |
564.05 - 582.90 |
0.9416 times |
Fri 17 October 2025 |
575.20 (-7.14%) |
616.35 |
557.00 - 625.05 |
6.1715 times |
Fri 10 October 2025 |
619.40 (3.04%) |
599.00 |
596.40 - 634.00 |
0.5415 times |
Fri 03 October 2025 |
601.10 (0.52%) |
591.50 |
570.10 - 608.30 |
0.174 times |
Fri 26 September 2025 |
598.00 (-2.08%) |
610.70 |
592.05 - 630.30 |
0.5355 times |
Fri 19 September 2025 |
610.70 (0.26%) |
605.00 |
595.10 - 622.00 |
0.4797 times |
Fri 12 September 2025 |
609.10 (-1.08%) |
624.00 |
601.00 - 624.00 |
0.2963 times |
Fri 05 September 2025 |
615.75 (-2.52%) |
641.05 |
606.70 - 641.05 |
0.2438 times |
Fri 29 August 2025 |
631.65 (-2.91%) |
653.00 |
626.00 - 665.00 |
0.3247 times |
Fri 22 August 2025 |
650.60 (0.27%) |
657.00 |
625.25 - 668.00 |
0.3048 times |
Monthly price and charts KeystoneRealtors Strong monthly Stock price targets for KeystoneRealtors RUSTOMJEE are 523.03 and 600.03 | Monthly Target 1 | 508.68 | | Monthly Target 2 | 537.37 | | Monthly Target 3 | 585.68333333333 | | Monthly Target 4 | 614.37 | | Monthly Target 5 | 662.68 |
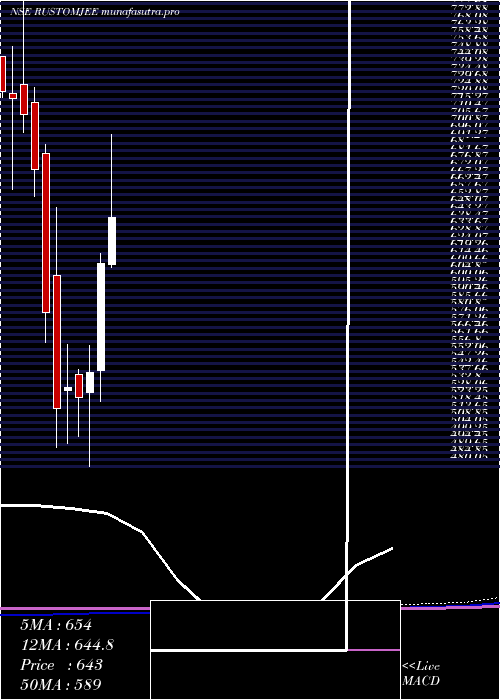
Monthly price and volumes Keystone Realtors
| Date |
Closing |
Open |
Range |
Volume |
Tue 28 October 2025 |
566.05 (-4.17%) |
595.00 |
557.00 - 634.00 |
2.7886 times |
Tue 30 September 2025 |
590.70 (-6.48%) |
641.05 |
570.10 - 641.05 |
0.5707 times |
Fri 29 August 2025 |
631.65 (1.64%) |
621.05 |
570.00 - 668.00 |
0.6346 times |
Thu 31 July 2025 |
621.45 (1.47%) |
612.40 |
600.20 - 697.00 |
1.65 times |
Mon 30 June 2025 |
612.45 (13.07%) |
542.90 |
522.65 - 619.00 |
0.9115 times |
Fri 30 May 2025 |
541.65 (3.09%) |
528.70 |
480.05 - 559.00 |
0.9782 times |
Wed 30 April 2025 |
525.40 (-1.21%) |
540.00 |
500.00 - 543.85 |
0.5317 times |
Fri 28 March 2025 |
531.85 (2.64%) |
529.70 |
495.00 - 559.75 |
0.7006 times |
Fri 28 February 2025 |
518.15 (-10.77%) |
605.15 |
492.30 - 649.40 |
0.7294 times |
Fri 31 January 2025 |
580.70 (-13.9%) |
684.85 |
561.05 - 690.30 |
0.5048 times |
Tue 31 December 2024 |
674.45 (-5.01%) |
718.00 |
656.30 - 728.00 |
0.5387 times |
DMA SMA EMA moving averages of Keystone Realtors RUSTOMJEE
DMA (daily moving average) of Keystone Realtors RUSTOMJEE
| DMA period | DMA value | | 5 day DMA | 571.45 | | 12 day DMA | 582.93 | | 20 day DMA | 591.57 | | 35 day DMA | 599.19 | | 50 day DMA | 610.19 | | 100 day DMA | 607.29 | | 150 day DMA | 579.64 | | 200 day DMA | 577.03 | EMA (exponential moving average) of Keystone Realtors RUSTOMJEE
| EMA period | EMA current | EMA prev | EMA prev2 | | 5 day EMA | 572.14 | 575.18 | 576.07 | | 12 day EMA | 580.75 | 583.42 | 585.24 | | 20 day EMA | 588.01 | 590.32 | 592.1 | | 35 day EMA | 597.56 | 599.41 | 600.94 | | 50 day EMA | 605.56 | 607.17 | 608.55 |
SMA (simple moving average) of Keystone Realtors RUSTOMJEE
| SMA period | SMA current | SMA prev | SMA prev2 | | 5 day SMA | 571.45 | 574.26 | 574.62 | | 12 day SMA | 582.93 | 587.74 | 591.65 | | 20 day SMA | 591.57 | 593.16 | 594.68 | | 35 day SMA | 599.19 | 600.61 | 601.8 | | 50 day SMA | 610.19 | 611.31 | 612.04 | | 100 day SMA | 607.29 | 606.91 | 606.47 | | 150 day SMA | 579.64 | 579.43 | 579.16 | | 200 day SMA | 577.03 | 577.43 | 577.93 |
|
|
