RushilDecor RUSHIL full analysis,charts,indicators,moving averages,SMA,DMA,EMA,ADX,MACD,RSIRushil Decor RUSHIL WideScreen charts, DMA,SMA,EMA technical analysis, forecast prediction, by indicators ADX,MACD,RSI,CCI NSE stock exchange
operates under Forest Products sector
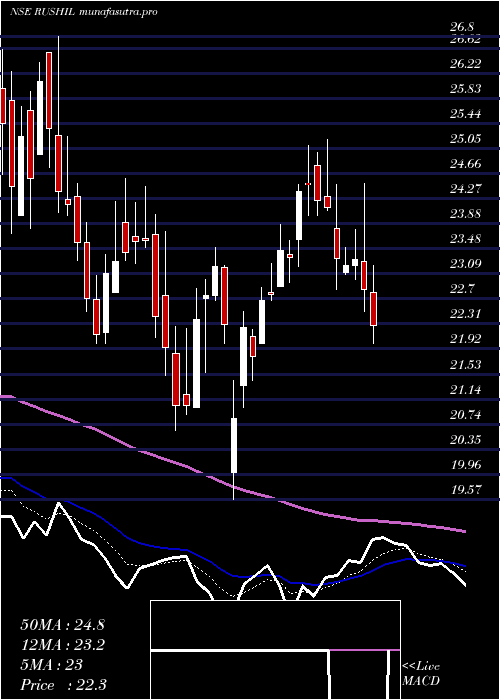
Daily price and charts and targets RushilDecor Strong Daily Stock price targets for RushilDecor RUSHIL are 26.95 and 27.79 | Daily Target 1 | 26.29 | | Daily Target 2 | 26.77 | | Daily Target 3 | 27.133333333333 | | Daily Target 4 | 27.61 | | Daily Target 5 | 27.97 |
Daily price and volume Rushil Decor
| Date |
Closing |
Open |
Range |
Volume |
Tue 28 October 2025 |
27.24 (0.81%) |
27.21 |
26.66 - 27.50 |
0.5153 times |
Mon 27 October 2025 |
27.02 (1.35%) |
26.66 |
26.34 - 27.47 |
0.9633 times |
Fri 24 October 2025 |
26.66 (-0.71%) |
26.85 |
26.40 - 27.04 |
0.7097 times |
Thu 23 October 2025 |
26.85 (-1.21%) |
27.18 |
26.51 - 27.40 |
0.6319 times |
Tue 21 October 2025 |
27.18 (1.76%) |
26.75 |
26.75 - 27.41 |
0.3017 times |
Mon 20 October 2025 |
26.71 (1.91%) |
26.19 |
26.19 - 27.39 |
1.0303 times |
Fri 17 October 2025 |
26.21 (0.15%) |
26.17 |
26.02 - 26.88 |
0.8306 times |
Thu 16 October 2025 |
26.17 (-2.42%) |
27.03 |
25.49 - 27.21 |
2.0002 times |
Wed 15 October 2025 |
26.82 (2.09%) |
26.27 |
26.12 - 27.48 |
1.326 times |
Tue 14 October 2025 |
26.27 (-4.44%) |
27.70 |
26.00 - 27.70 |
1.691 times |
Mon 13 October 2025 |
27.49 (-3.78%) |
28.50 |
27.21 - 28.50 |
1.1208 times |
Weekly price and charts RushilDecor Strong weekly Stock price targets for RushilDecor RUSHIL are 26.79 and 27.95 | Weekly Target 1 | 25.87 | | Weekly Target 2 | 26.55 | | Weekly Target 3 | 27.026666666667 | | Weekly Target 4 | 27.71 | | Weekly Target 5 | 28.19 |
Weekly price and volumes for Rushil Decor
| Date |
Closing |
Open |
Range |
Volume |
Tue 28 October 2025 |
27.24 (2.18%) |
26.66 |
26.34 - 27.50 |
0.0852 times |
Fri 24 October 2025 |
26.66 (1.72%) |
26.19 |
26.19 - 27.41 |
0.1541 times |
Fri 17 October 2025 |
26.21 (-8.26%) |
28.50 |
25.49 - 28.50 |
0.4016 times |
Fri 10 October 2025 |
28.57 (-2.79%) |
29.50 |
26.87 - 29.67 |
0.3361 times |
Fri 03 October 2025 |
29.39 (2.05%) |
29.21 |
28.00 - 30.00 |
0.1834 times |
Fri 26 September 2025 |
28.80 (-9.46%) |
31.75 |
28.37 - 32.79 |
0.6252 times |
Fri 19 September 2025 |
31.81 (6.46%) |
29.65 |
29.49 - 33.99 |
2.2883 times |
Fri 12 September 2025 |
29.88 (7.37%) |
27.90 |
26.25 - 31.80 |
1.8068 times |
Fri 05 September 2025 |
27.83 (2.05%) |
27.10 |
25.55 - 30.10 |
1.5636 times |
Fri 29 August 2025 |
27.27 (17.24%) |
23.01 |
21.69 - 27.76 |
2.5558 times |
Fri 22 August 2025 |
23.26 (7.99%) |
21.51 |
21.38 - 23.70 |
0.2114 times |
Monthly price and charts RushilDecor Strong monthly Stock price targets for RushilDecor RUSHIL are 24.11 and 28.62 | Monthly Target 1 | 23.07 | | Monthly Target 2 | 25.15 | | Monthly Target 3 | 27.576666666667 | | Monthly Target 4 | 29.66 | | Monthly Target 5 | 32.09 |
Monthly price and volumes Rushil Decor
| Date |
Closing |
Open |
Range |
Volume |
Tue 28 October 2025 |
27.24 (-4.95%) |
29.10 |
25.49 - 30.00 |
0.4865 times |
Tue 30 September 2025 |
28.66 (5.1%) |
27.10 |
25.55 - 33.99 |
2.9566 times |
Fri 29 August 2025 |
27.27 (10.72%) |
24.47 |
21.38 - 27.76 |
1.5152 times |
Thu 31 July 2025 |
24.63 (-13.24%) |
28.53 |
23.81 - 29.20 |
0.5224 times |
Mon 30 June 2025 |
28.39 (-4.57%) |
29.80 |
27.25 - 32.00 |
1.4422 times |
Fri 30 May 2025 |
29.75 (30.25%) |
22.80 |
20.78 - 30.90 |
0.8391 times |
Wed 30 April 2025 |
22.84 (8.56%) |
21.00 |
19.57 - 25.20 |
0.4806 times |
Fri 28 March 2025 |
21.04 (-17.3%) |
25.80 |
20.65 - 26.80 |
0.9718 times |
Fri 28 February 2025 |
25.44 (-12.34%) |
28.86 |
24.36 - 29.88 |
0.2934 times |
Fri 31 January 2025 |
29.02 (-13.06%) |
33.28 |
25.99 - 34.49 |
0.4923 times |
Tue 31 December 2024 |
33.38 (-1.39%) |
33.94 |
31.45 - 37.89 |
0.7682 times |
DMA SMA EMA moving averages of Rushil Decor RUSHIL
DMA (daily moving average) of Rushil Decor RUSHIL
| DMA period | DMA value | | 5 day DMA | 26.99 | | 12 day DMA | 26.93 | | 20 day DMA | 27.41 | | 35 day DMA | 28.61 | | 50 day DMA | 27.5 | | 100 day DMA | 27.45 | | 150 day DMA | 26.37 | | 200 day DMA | 26.67 | EMA (exponential moving average) of Rushil Decor RUSHIL
| EMA period | EMA current | EMA prev | EMA prev2 | | 5 day EMA | 26.99 | 26.86 | 26.78 | | 12 day EMA | 27.13 | 27.11 | 27.13 | | 20 day EMA | 27.4 | 27.42 | 27.46 | | 35 day EMA | 27.11 | 27.1 | 27.11 | | 50 day EMA | 27.07 | 27.06 | 27.06 |
SMA (simple moving average) of Rushil Decor RUSHIL
| SMA period | SMA current | SMA prev | SMA prev2 | | 5 day SMA | 26.99 | 26.88 | 26.72 | | 12 day SMA | 26.93 | 26.94 | 26.95 | | 20 day SMA | 27.41 | 27.49 | 27.64 | | 35 day SMA | 28.61 | 28.62 | 28.6 | | 50 day SMA | 27.5 | 27.4 | 27.3 | | 100 day SMA | 27.45 | 27.49 | 27.52 | | 150 day SMA | 26.37 | 26.35 | 26.32 | | 200 day SMA | 26.67 | 26.7 | 26.73 |
|
|
