RupaCompany RUPA full analysis,charts,indicators,moving averages,SMA,DMA,EMA,ADX,MACD,RSIRupa Company RUPA WideScreen charts, DMA,SMA,EMA technical analysis, forecast prediction, by indicators ADX,MACD,RSI,CCI NSE stock exchange
operates under Other Apparels & Accessories sector
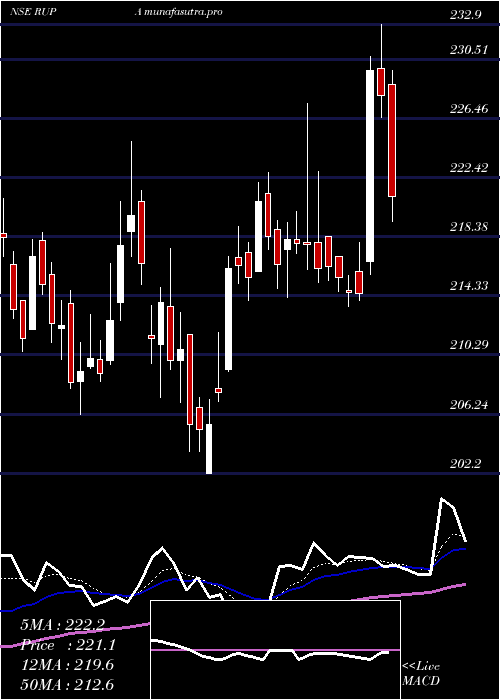
Daily price and charts and targets RupaCompany Strong Daily Stock price targets for RupaCompany RUPA are 195.44 and 198.28 | Daily Target 1 | 193.4 | | Daily Target 2 | 194.63 | | Daily Target 3 | 196.24 | | Daily Target 4 | 197.47 | | Daily Target 5 | 199.08 |
Daily price and volume Rupa Company
| Date |
Closing |
Open |
Range |
Volume |
Tue 28 October 2025 |
195.86 (-0.16%) |
195.37 |
195.01 - 197.85 |
1.0491 times |
Mon 27 October 2025 |
196.17 (-0.01%) |
197.00 |
195.20 - 197.00 |
0.8346 times |
Fri 24 October 2025 |
196.18 (-0.38%) |
197.31 |
194.77 - 197.31 |
1.2377 times |
Thu 23 October 2025 |
196.92 (0.55%) |
197.00 |
196.19 - 198.50 |
1.1908 times |
Tue 21 October 2025 |
195.84 (0.29%) |
196.00 |
195.00 - 196.68 |
0.4341 times |
Mon 20 October 2025 |
195.27 (-0.36%) |
194.01 |
193.80 - 196.54 |
0.8396 times |
Fri 17 October 2025 |
195.97 (-0.91%) |
196.70 |
193.21 - 199.53 |
1.6322 times |
Thu 16 October 2025 |
197.76 (0.29%) |
197.90 |
196.39 - 199.20 |
0.8909 times |
Wed 15 October 2025 |
197.18 (-0.78%) |
199.60 |
196.70 - 199.79 |
0.7909 times |
Tue 14 October 2025 |
198.73 (0.37%) |
197.50 |
197.50 - 201.65 |
1.1 times |
Mon 13 October 2025 |
198.00 (-0.73%) |
197.60 |
197.00 - 198.90 |
0.7527 times |
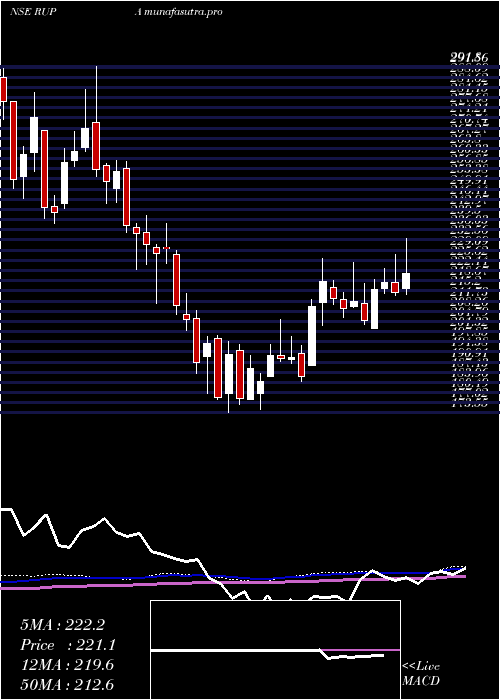
Weekly price and charts RupaCompany Strong weekly Stock price targets for RupaCompany RUPA are 194.02 and 196.86 | Weekly Target 1 | 193.4 | | Weekly Target 2 | 194.63 | | Weekly Target 3 | 196.24 | | Weekly Target 4 | 197.47 | | Weekly Target 5 | 199.08 |
Weekly price and volumes for Rupa Company
| Date |
Closing |
Open |
Range |
Volume |
Tue 28 October 2025 |
195.86 (-0.16%) |
197.00 |
195.01 - 197.85 |
0.2281 times |
Fri 24 October 2025 |
196.18 (0.11%) |
194.01 |
193.80 - 198.50 |
0.4483 times |
Fri 17 October 2025 |
195.97 (-1.74%) |
197.60 |
193.21 - 201.65 |
0.6257 times |
Fri 10 October 2025 |
199.45 (-3.98%) |
207.71 |
197.93 - 207.71 |
0.7186 times |
Fri 03 October 2025 |
207.71 (4.35%) |
199.20 |
198.10 - 209.90 |
1.1655 times |
Fri 26 September 2025 |
199.05 (-5%) |
209.50 |
197.29 - 209.50 |
1.0552 times |
Fri 19 September 2025 |
209.52 (2.82%) |
205.90 |
200.10 - 212.84 |
1.4347 times |
Fri 12 September 2025 |
203.78 (3.37%) |
197.91 |
195.30 - 210.90 |
2.2424 times |
Fri 05 September 2025 |
197.13 (4.28%) |
191.30 |
189.00 - 202.10 |
1.0279 times |
Fri 29 August 2025 |
189.04 (-4.94%) |
197.00 |
188.10 - 201.63 |
1.0536 times |
Fri 22 August 2025 |
198.86 (3.1%) |
195.40 |
195.10 - 206.40 |
1.5881 times |
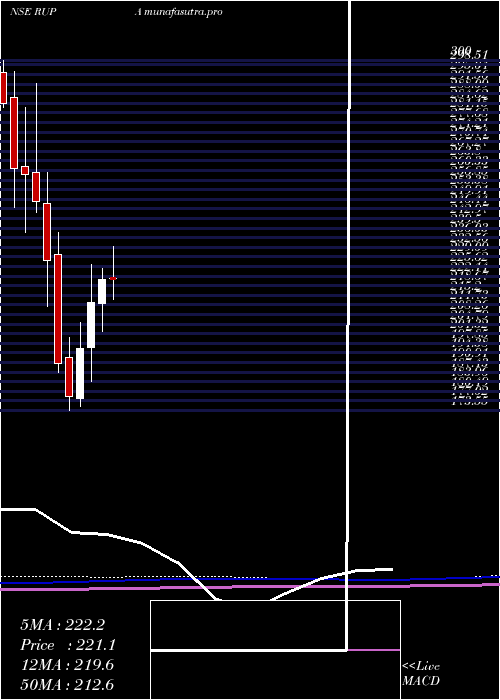
Monthly price and charts RupaCompany Strong monthly Stock price targets for RupaCompany RUPA are 186.19 and 202.88 | Monthly Target 1 | 182.97 | | Monthly Target 2 | 189.41 | | Monthly Target 3 | 199.65666666667 | | Monthly Target 4 | 206.1 | | Monthly Target 5 | 216.35 |
Monthly price and volumes Rupa Company
| Date |
Closing |
Open |
Range |
Volume |
Tue 28 October 2025 |
195.86 (-4.98%) |
206.00 |
193.21 - 209.90 |
0.3788 times |
Tue 30 September 2025 |
206.13 (9.04%) |
191.30 |
189.00 - 212.84 |
1.0279 times |
Fri 29 August 2025 |
189.04 (-11.08%) |
212.61 |
188.00 - 218.00 |
1.0554 times |
Thu 31 July 2025 |
212.60 (-3.69%) |
221.35 |
210.71 - 232.90 |
1.9462 times |
Mon 30 June 2025 |
220.75 (3.92%) |
212.10 |
202.20 - 224.90 |
0.8813 times |
Fri 30 May 2025 |
212.42 (8.33%) |
196.34 |
184.19 - 226.36 |
1.1436 times |
Wed 30 April 2025 |
196.09 (9.81%) |
178.00 |
174.80 - 205.29 |
0.8917 times |
Fri 28 March 2025 |
178.58 (-6.32%) |
192.85 |
173.55 - 199.90 |
1.3234 times |
Fri 28 February 2025 |
190.63 (-16.33%) |
230.00 |
187.11 - 238.05 |
0.6464 times |
Fri 31 January 2025 |
227.84 (-8.48%) |
248.25 |
211.00 - 259.75 |
0.7054 times |
Tue 31 December 2024 |
248.95 (-3.82%) |
259.60 |
244.95 - 291.80 |
1.3023 times |
DMA SMA EMA moving averages of Rupa Company RUPA
DMA (daily moving average) of Rupa Company RUPA
| DMA period | DMA value | | 5 day DMA | 196.19 | | 12 day DMA | 196.94 | | 20 day DMA | 199.39 | | 35 day DMA | 201.65 | | 50 day DMA | 199.67 | | 100 day DMA | 206.66 | | 150 day DMA | 203.36 | | 200 day DMA | 206.03 | EMA (exponential moving average) of Rupa Company RUPA
| EMA period | EMA current | EMA prev | EMA prev2 | | 5 day EMA | 196.21 | 196.38 | 196.49 | | 12 day EMA | 197.3 | 197.56 | 197.81 | | 20 day EMA | 198.44 | 198.71 | 198.98 | | 35 day EMA | 199.06 | 199.25 | 199.43 | | 50 day EMA | 199.66 | 199.81 | 199.96 |
SMA (simple moving average) of Rupa Company RUPA
| SMA period | SMA current | SMA prev | SMA prev2 | | 5 day SMA | 196.19 | 196.08 | 196.04 | | 12 day SMA | 196.94 | 197.41 | 197.64 | | 20 day SMA | 199.39 | 199.55 | 199.75 | | 35 day SMA | 201.65 | 201.68 | 201.63 | | 50 day SMA | 199.67 | 199.64 | 199.98 | | 100 day SMA | 206.66 | 206.8 | 206.92 | | 150 day SMA | 203.36 | 203.3 | 203.19 | | 200 day SMA | 206.03 | 206.25 | 206.55 |
|
|
