RuchiInfrastructure RUCHINFRA_BE full analysis,charts,indicators,moving averages,SMA,DMA,EMA,ADX,MACD,RSIRuchi Infrastructure RUCHINFRA_BE WideScreen charts, DMA,SMA,EMA technical analysis, forecast prediction, by indicators ADX,MACD,RSI,CCI NSE stock exchange
Daily price and charts and targets RuchiInfrastructure Strong Daily Stock price targets for RuchiInfrastructure RUCHINFRA_BE are 7.56 and 7.77 | Daily Target 1 | 7.5 | | Daily Target 2 | 7.62 | | Daily Target 3 | 7.7133333333333 | | Daily Target 4 | 7.83 | | Daily Target 5 | 7.92 |
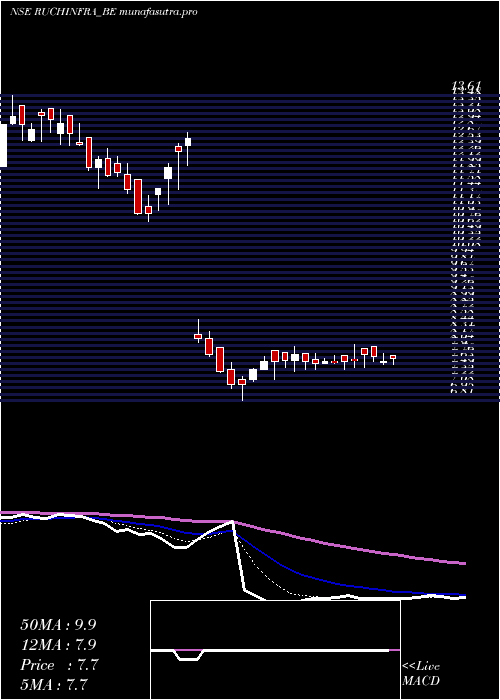
Daily price and volume Ruchi Infrastructure
| Date |
Closing |
Open |
Range |
Volume |
Mon 14 July 2025 |
7.73 (0.78%) |
7.80 |
7.60 - 7.81 |
0.9026 times |
Fri 11 July 2025 |
7.67 (-1.41%) |
7.64 |
7.60 - 7.85 |
0.7036 times |
Thu 10 July 2025 |
7.78 (-0.64%) |
8.00 |
7.67 - 8.00 |
0.739 times |
Wed 09 July 2025 |
7.83 (1.69%) |
7.97 |
7.55 - 7.97 |
0.8851 times |
Tue 08 July 2025 |
7.70 (0.26%) |
7.72 |
7.55 - 8.06 |
1.6044 times |
Mon 07 July 2025 |
7.68 (0.26%) |
7.81 |
7.50 - 7.81 |
0.8663 times |
Fri 04 July 2025 |
7.66 (-0.26%) |
7.68 |
7.62 - 7.80 |
0.7399 times |
Thu 03 July 2025 |
7.68 (0.79%) |
7.62 |
7.62 - 7.75 |
1.0528 times |
Wed 02 July 2025 |
7.62 (-0.65%) |
7.72 |
7.50 - 7.85 |
1.178 times |
Tue 01 July 2025 |
7.67 (-1.92%) |
7.85 |
7.50 - 7.85 |
1.3283 times |
Mon 30 June 2025 |
7.82 (1.69%) |
7.69 |
7.46 - 8.00 |
1.4013 times |
Weekly price and charts RuchiInfrastructure Strong weekly Stock price targets for RuchiInfrastructure RUCHINFRA_BE are 7.56 and 7.77 | Weekly Target 1 | 7.5 | | Weekly Target 2 | 7.62 | | Weekly Target 3 | 7.7133333333333 | | Weekly Target 4 | 7.83 | | Weekly Target 5 | 7.92 |
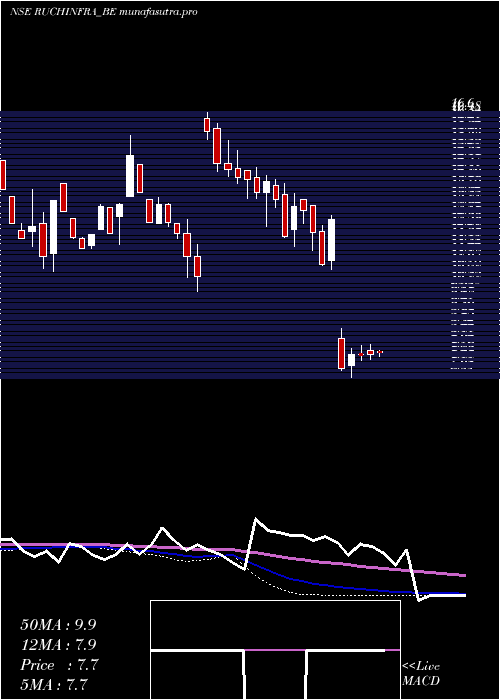
Weekly price and volumes for Ruchi Infrastructure
| Date |
Closing |
Open |
Range |
Volume |
Mon 14 July 2025 |
7.73 (0.78%) |
7.80 |
7.60 - 7.81 |
0.1331 times |
Fri 11 July 2025 |
7.67 (0.13%) |
7.81 |
7.50 - 8.06 |
0.7077 times |
Fri 04 July 2025 |
7.66 (-0.39%) |
7.69 |
7.46 - 8.00 |
0.8407 times |
Fri 27 June 2025 |
7.69 (7.25%) |
7.27 |
6.81 - 7.91 |
2.0526 times |
Fri 20 June 2025 |
7.17 (-43.36%) |
8.27 |
7.08 - 8.62 |
2.9101 times |
Fri 29 November 2024 |
12.66 (15.2%) |
11.14 |
10.80 - 12.80 |
0.8518 times |
Fri 22 November 2024 |
10.99 (-9.77%) |
12.21 |
10.96 - 12.43 |
0.9221 times |
Thu 14 November 2024 |
12.18 (-6.24%) |
13.18 |
11.53 - 13.18 |
0.3478 times |
Fri 08 November 2024 |
12.99 (-1.22%) |
13.40 |
12.52 - 13.40 |
0.5069 times |
Fri 01 November 2024 |
13.15 (9.31%) |
12.27 |
11.67 - 13.61 |
0.7271 times |
Fri 25 October 2024 |
12.03 (-10.29%) |
13.59 |
12.00 - 13.98 |
0.8083 times |
Monthly price and charts RuchiInfrastructure Strong monthly Stock price targets for RuchiInfrastructure RUCHINFRA_BE are 7.34 and 7.9 | Monthly Target 1 | 7.2 | | Monthly Target 2 | 7.47 | | Monthly Target 3 | 7.7633333333333 | | Monthly Target 4 | 8.03 | | Monthly Target 5 | 8.32 |
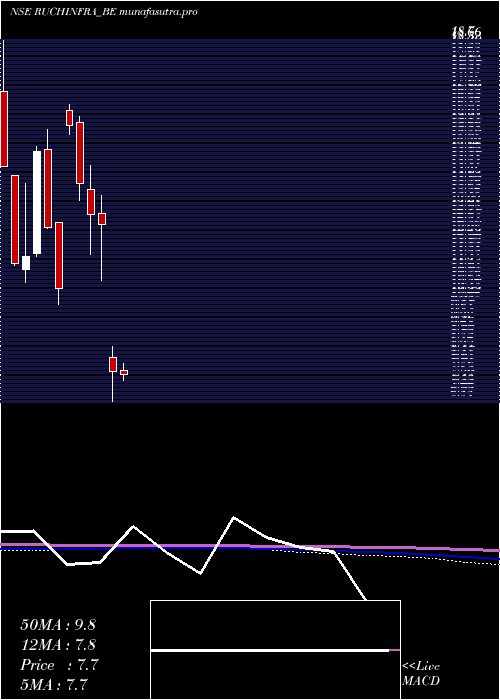
Monthly price and volumes Ruchi Infrastructure
| Date |
Closing |
Open |
Range |
Volume |
Mon 14 July 2025 |
7.73 (-1.15%) |
7.85 |
7.50 - 8.06 |
0.2692 times |
Mon 30 June 2025 |
7.82 (-38.23%) |
8.27 |
6.81 - 8.62 |
0.9435 times |
Fri 29 November 2024 |
12.66 (-2.39%) |
13.00 |
10.80 - 13.61 |
0.4939 times |
Thu 31 October 2024 |
12.97 (-7.22%) |
13.81 |
11.67 - 14.58 |
0.6358 times |
Mon 30 September 2024 |
13.98 (-12.02%) |
16.00 |
13.42 - 16.19 |
1.7902 times |
Fri 30 August 2024 |
15.89 (50.62%) |
16.38 |
15.60 - 16.60 |
0.1587 times |
Fri 22 March 2024 |
10.55 (-15.94%) |
12.70 |
10.00 - 12.70 |
2.55 times |
Thu 29 February 2024 |
12.55 (-16.61%) |
15.10 |
12.50 - 15.75 |
0.7255 times |
Wed 31 January 2024 |
15.05 (29.74%) |
11.70 |
11.60 - 15.20 |
1.2523 times |
Fri 29 December 2023 |
11.60 (2.2%) |
11.15 |
10.75 - 14.00 |
1.1808 times |
Thu 30 November 2023 |
11.35 (-21.99%) |
14.25 |
11.30 - 14.25 |
2.1525 times |
DMA SMA EMA moving averages of Ruchi Infrastructure RUCHINFRA_BE
DMA (daily moving average) of Ruchi Infrastructure RUCHINFRA_BE
| DMA period | DMA value | | 5 day DMA | 7.74 | | 12 day DMA | 7.71 | | 20 day DMA | 7.66 | | 35 day DMA | 9.56 | | 50 day DMA | 10.51 | | 100 day DMA | 11.93 | | 150 day DMA | 12.26 | | 200 day DMA | 12.7 | EMA (exponential moving average) of Ruchi Infrastructure RUCHINFRA_BE
| EMA period | EMA current | EMA prev | EMA prev2 | | 5 day EMA | 7.72 | 7.72 | 7.75 | | 12 day EMA | 7.86 | 7.88 | 7.92 | | 20 day EMA | 8.29 | 8.35 | 8.42 | | 35 day EMA | 9.25 | 9.34 | 9.44 | | 50 day EMA | 10.52 | 10.63 | 10.75 |
SMA (simple moving average) of Ruchi Infrastructure RUCHINFRA_BE
| SMA period | SMA current | SMA prev | SMA prev2 | | 5 day SMA | 7.74 | 7.73 | 7.73 | | 12 day SMA | 7.71 | 7.71 | 7.71 | | 20 day SMA | 7.66 | 7.91 | 8.14 | | 35 day SMA | 9.56 | 9.71 | 9.86 | | 50 day SMA | 10.51 | 10.63 | 10.75 | | 100 day SMA | 11.93 | 11.98 | 12.03 | | 150 day SMA | 12.26 | 12.29 | 12.32 | | 200 day SMA | 12.7 | 12.74 | 12.78 |
|
|
