RubyMills RUBYMILLS full analysis,charts,indicators,moving averages,SMA,DMA,EMA,ADX,MACD,RSIRuby Mills RUBYMILLS WideScreen charts, DMA,SMA,EMA technical analysis, forecast prediction, by indicators ADX,MACD,RSI,CCI NSE stock exchange
operates under Textiles sector
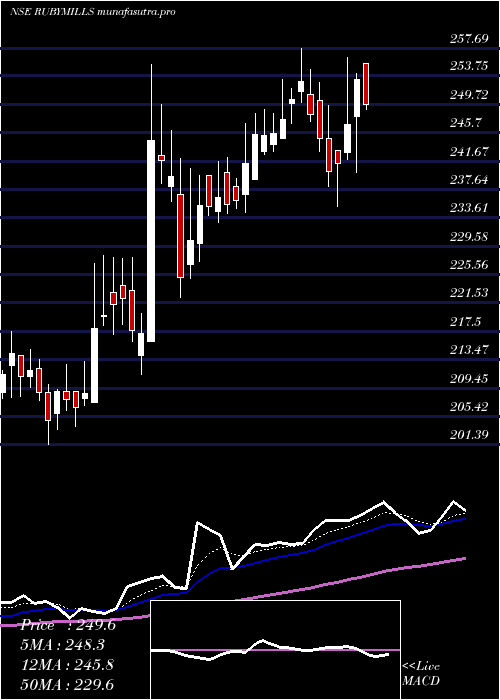
Daily price and charts and targets RubyMills Strong Daily Stock price targets for RubyMills RUBYMILLS are 220.5 and 231.65 | Daily Target 1 | 211.82 | | Daily Target 2 | 218.03 | | Daily Target 3 | 222.96666666667 | | Daily Target 4 | 229.18 | | Daily Target 5 | 234.12 |
Daily price and volume Ruby Mills
| Date |
Closing |
Open |
Range |
Volume |
Wed 29 October 2025 |
224.25 (3.02%) |
218.78 |
216.75 - 227.90 |
2.0717 times |
Tue 28 October 2025 |
217.67 (-1.52%) |
221.97 |
214.19 - 223.00 |
1.9114 times |
Mon 27 October 2025 |
221.04 (-0.36%) |
220.60 |
220.00 - 222.50 |
0.7022 times |
Fri 24 October 2025 |
221.84 (-0.56%) |
221.13 |
219.33 - 223.90 |
0.5065 times |
Thu 23 October 2025 |
223.08 (1.29%) |
221.00 |
221.00 - 224.75 |
1.2507 times |
Tue 21 October 2025 |
220.24 (0.94%) |
220.01 |
219.00 - 223.80 |
1.2406 times |
Mon 20 October 2025 |
218.19 (-0.92%) |
222.40 |
217.00 - 222.40 |
0.7949 times |
Fri 17 October 2025 |
220.22 (-1.37%) |
222.41 |
219.00 - 224.50 |
0.5305 times |
Thu 16 October 2025 |
223.28 (0.57%) |
222.98 |
220.00 - 226.58 |
0.6726 times |
Wed 15 October 2025 |
222.02 (-0.61%) |
223.39 |
220.10 - 223.49 |
0.3191 times |
Tue 14 October 2025 |
223.39 (1.67%) |
219.72 |
217.00 - 224.95 |
1.3512 times |
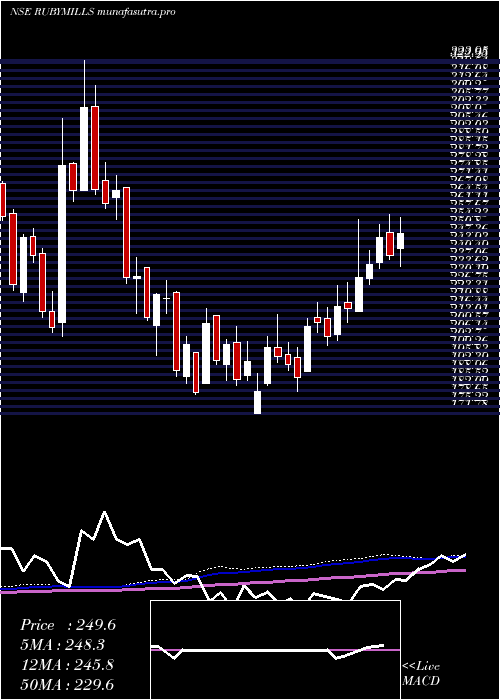
Weekly price and charts RubyMills Strong weekly Stock price targets for RubyMills RUBYMILLS are 219.22 and 232.93 | Weekly Target 1 | 208.4 | | Weekly Target 2 | 216.33 | | Weekly Target 3 | 222.11333333333 | | Weekly Target 4 | 230.04 | | Weekly Target 5 | 235.82 |
Weekly price and volumes for Ruby Mills
| Date |
Closing |
Open |
Range |
Volume |
Wed 29 October 2025 |
224.25 (1.09%) |
220.60 |
214.19 - 227.90 |
0.4762 times |
Fri 24 October 2025 |
221.84 (0.74%) |
222.40 |
217.00 - 224.75 |
0.3855 times |
Fri 17 October 2025 |
220.22 (-1.02%) |
222.00 |
217.00 - 226.58 |
0.3713 times |
Fri 10 October 2025 |
222.48 (-1.44%) |
226.77 |
215.50 - 230.46 |
0.5928 times |
Fri 03 October 2025 |
225.74 (1.97%) |
223.61 |
218.50 - 229.80 |
0.3681 times |
Fri 26 September 2025 |
221.37 (-5.98%) |
236.39 |
219.50 - 236.50 |
0.8808 times |
Fri 19 September 2025 |
235.44 (3.39%) |
225.09 |
224.30 - 263.98 |
5.1609 times |
Fri 12 September 2025 |
227.71 (1.77%) |
224.70 |
222.50 - 232.00 |
0.7266 times |
Fri 05 September 2025 |
223.75 (1.59%) |
222.99 |
221.50 - 230.00 |
0.5275 times |
Fri 29 August 2025 |
220.25 (-5.69%) |
234.15 |
219.00 - 234.15 |
0.5103 times |
Fri 22 August 2025 |
233.55 (-2.97%) |
241.50 |
230.25 - 241.50 |
0.8683 times |
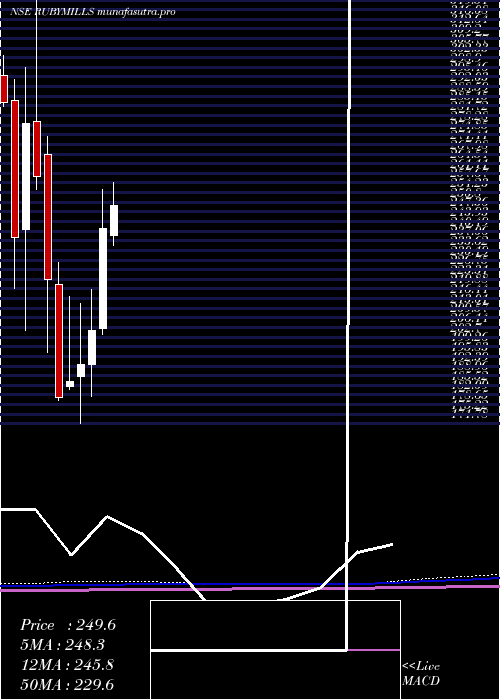
Monthly price and charts RubyMills Strong monthly Stock price targets for RubyMills RUBYMILLS are 219.22 and 235.49 | Monthly Target 1 | 206.7 | | Monthly Target 2 | 215.47 | | Monthly Target 3 | 222.96666666667 | | Monthly Target 4 | 231.74 | | Monthly Target 5 | 239.24 |
Monthly price and volumes Ruby Mills
| Date |
Closing |
Open |
Range |
Volume |
Wed 29 October 2025 |
224.25 (1.91%) |
220.69 |
214.19 - 230.46 |
0.2479 times |
Tue 30 September 2025 |
220.04 (-0.1%) |
222.99 |
218.50 - 263.98 |
0.916 times |
Fri 29 August 2025 |
220.25 (-13.06%) |
255.00 |
219.00 - 257.10 |
0.5975 times |
Thu 31 July 2025 |
253.35 (4.99%) |
239.00 |
230.41 - 269.00 |
1.2335 times |
Mon 30 June 2025 |
241.31 (17.76%) |
205.90 |
203.62 - 255.40 |
2.1806 times |
Fri 30 May 2025 |
204.91 (6.24%) |
192.89 |
181.47 - 219.80 |
0.5408 times |
Wed 30 April 2025 |
192.88 (3.25%) |
188.50 |
171.78 - 214.70 |
0.8884 times |
Fri 28 March 2025 |
186.80 (3.08%) |
184.99 |
183.96 - 217.21 |
2.0214 times |
Fri 28 February 2025 |
181.22 (-18.81%) |
221.29 |
180.00 - 229.35 |
0.4435 times |
Fri 31 January 2025 |
223.20 (-14.2%) |
267.95 |
197.10 - 274.25 |
0.9304 times |
Tue 31 December 2024 |
260.15 (-6.71%) |
279.45 |
255.25 - 323.95 |
4.585 times |
DMA SMA EMA moving averages of Ruby Mills RUBYMILLS
DMA (daily moving average) of Ruby Mills RUBYMILLS
| DMA period | DMA value | | 5 day DMA | 221.58 | | 12 day DMA | 221.25 | | 20 day DMA | 221.96 | | 35 day DMA | 225.56 | | 50 day DMA | 226.14 | | 100 day DMA | 232.51 | | 150 day DMA | 221.48 | | 200 day DMA | 218.57 | EMA (exponential moving average) of Ruby Mills RUBYMILLS
| EMA period | EMA current | EMA prev | EMA prev2 | | 5 day EMA | 221.5 | 220.12 | 221.34 | | 12 day EMA | 221.66 | 221.19 | 221.83 | | 20 day EMA | 222.64 | 222.47 | 222.97 | | 35 day EMA | 224.36 | 224.37 | 224.76 | | 50 day EMA | 226.58 | 226.68 | 227.05 |
SMA (simple moving average) of Ruby Mills RUBYMILLS
| SMA period | SMA current | SMA prev | SMA prev2 | | 5 day SMA | 221.58 | 220.77 | 220.88 | | 12 day SMA | 221.25 | 221.1 | 221.25 | | 20 day SMA | 221.96 | 221.84 | 222.02 | | 35 day SMA | 225.56 | 225.63 | 225.8 | | 50 day SMA | 226.14 | 226.47 | 226.94 | | 100 day SMA | 232.51 | 232.36 | 232.25 | | 150 day SMA | 221.48 | 221.3 | 221.16 | | 200 day SMA | 218.57 | 218.72 | 218.88 |
|
|
