RattanindiaPower RTNPOWER full analysis,charts,indicators,moving averages,SMA,DMA,EMA,ADX,MACD,RSIRattanindia Power RTNPOWER WideScreen charts, DMA,SMA,EMA technical analysis, forecast prediction, by indicators ADX,MACD,RSI,CCI NSE stock exchange
operates under Electric Utilities sector
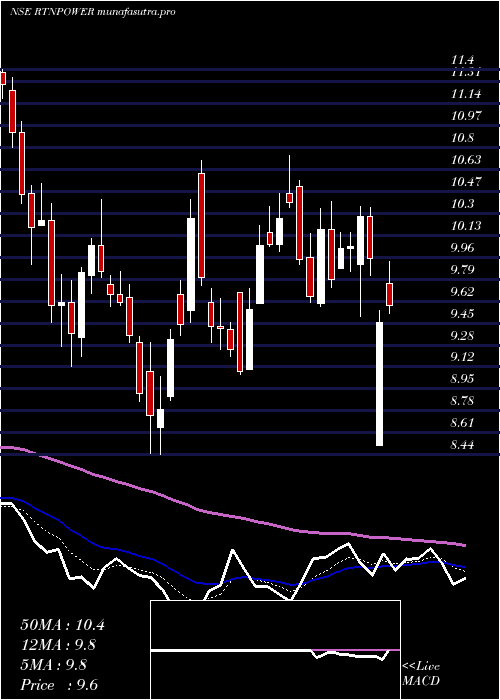
Daily price and charts and targets RattanindiaPower Strong Daily Stock price targets for RattanindiaPower RTNPOWER are 9.54 and 9.79 | Daily Target 1 | 9.48 | | Daily Target 2 | 9.59 | | Daily Target 3 | 9.73 | | Daily Target 4 | 9.84 | | Daily Target 5 | 9.98 |
Daily price and volume Rattanindia Power
| Date |
Closing |
Open |
Range |
Volume |
Fri 05 December 2025 |
9.70 (-0.92%) |
9.78 |
9.62 - 9.87 |
0.9314 times |
Thu 04 December 2025 |
9.79 (0.62%) |
9.74 |
9.64 - 9.89 |
1.1265 times |
Wed 03 December 2025 |
9.73 (-1.92%) |
9.92 |
9.70 - 10.00 |
1.1052 times |
Tue 02 December 2025 |
9.92 (-0.9%) |
9.95 |
9.89 - 10.02 |
0.772 times |
Mon 01 December 2025 |
10.01 (-0.1%) |
10.09 |
9.96 - 10.09 |
0.6248 times |
Fri 28 November 2025 |
10.02 (-0.69%) |
10.21 |
9.98 - 10.21 |
0.9196 times |
Thu 27 November 2025 |
10.09 (0.5%) |
10.10 |
10.00 - 10.22 |
1.1103 times |
Wed 26 November 2025 |
10.04 (1.41%) |
9.95 |
9.89 - 10.10 |
1.0131 times |
Tue 25 November 2025 |
9.90 (-0.5%) |
9.95 |
9.86 - 10.02 |
1.1537 times |
Mon 24 November 2025 |
9.95 (-1.68%) |
10.12 |
9.90 - 10.16 |
1.2433 times |
Fri 21 November 2025 |
10.12 (-1.27%) |
10.36 |
10.05 - 10.37 |
1.5046 times |
Weekly price and charts RattanindiaPower Strong weekly Stock price targets for RattanindiaPower RTNPOWER are 9.43 and 9.9 | Weekly Target 1 | 9.33 | | Weekly Target 2 | 9.52 | | Weekly Target 3 | 9.8033333333333 | | Weekly Target 4 | 9.99 | | Weekly Target 5 | 10.27 |
Weekly price and volumes for Rattanindia Power
| Date |
Closing |
Open |
Range |
Volume |
Fri 05 December 2025 |
9.70 (-3.19%) |
10.09 |
9.62 - 10.09 |
0.6996 times |
Fri 28 November 2025 |
10.02 (-0.99%) |
10.12 |
9.86 - 10.22 |
0.8346 times |
Fri 21 November 2025 |
10.12 (-1.08%) |
10.25 |
10.02 - 10.78 |
1.8392 times |
Fri 14 November 2025 |
10.23 (-1.45%) |
10.40 |
10.20 - 10.55 |
0.8057 times |
Fri 07 November 2025 |
10.38 (-4.95%) |
10.95 |
10.24 - 11.10 |
0.9154 times |
Fri 31 October 2025 |
10.92 (-1.71%) |
11.10 |
10.75 - 11.68 |
1.5073 times |
Fri 24 October 2025 |
11.11 (0.63%) |
11.06 |
10.96 - 11.42 |
0.5444 times |
Fri 17 October 2025 |
11.04 (-3.83%) |
11.36 |
10.97 - 11.39 |
0.8348 times |
Fri 10 October 2025 |
11.48 (-1.54%) |
11.70 |
11.10 - 11.94 |
1.2181 times |
Fri 03 October 2025 |
11.66 (1.13%) |
11.54 |
11.19 - 11.78 |
0.801 times |
Fri 26 September 2025 |
11.53 (-7.09%) |
12.41 |
11.46 - 12.49 |
0.8907 times |
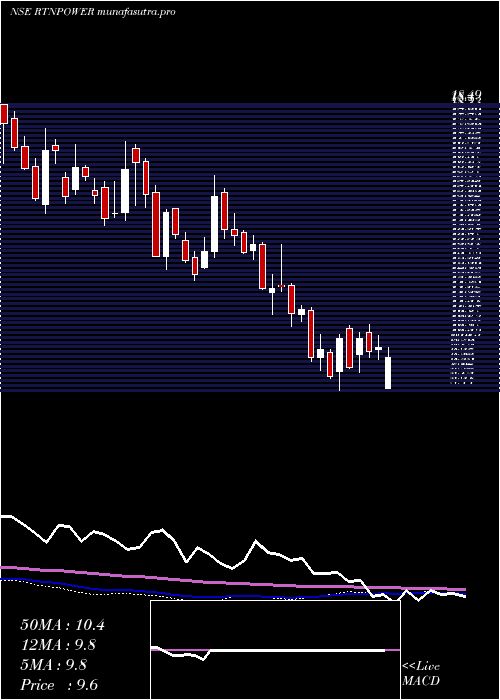
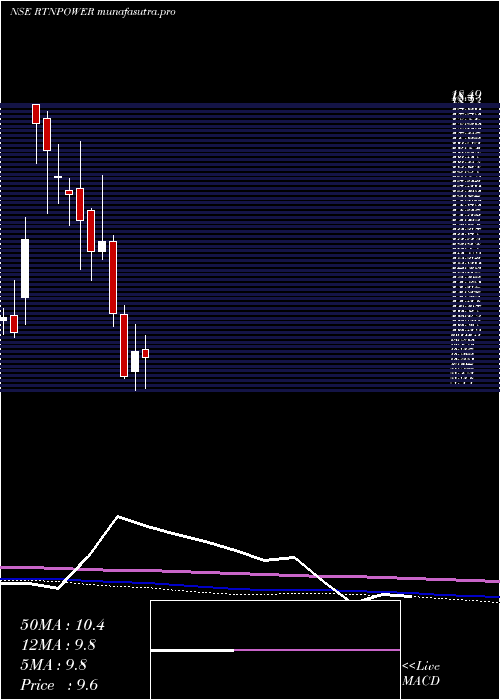
Monthly price and charts RattanindiaPower Strong monthly Stock price targets for RattanindiaPower RTNPOWER are 9.43 and 9.9 | Monthly Target 1 | 9.33 | | Monthly Target 2 | 9.52 | | Monthly Target 3 | 9.8033333333333 | | Monthly Target 4 | 9.99 | | Monthly Target 5 | 10.27 |
Monthly price and volumes Rattanindia Power
| Date |
Closing |
Open |
Range |
Volume |
Fri 05 December 2025 |
9.70 (-3.19%) |
10.09 |
9.62 - 10.09 |
0.052 times |
Fri 28 November 2025 |
10.02 (-8.24%) |
10.95 |
9.86 - 11.10 |
0.3267 times |
Fri 31 October 2025 |
10.92 (-2.67%) |
11.25 |
10.75 - 11.94 |
0.3338 times |
Tue 30 September 2025 |
11.22 (-8.71%) |
12.29 |
11.19 - 12.84 |
0.384 times |
Fri 29 August 2025 |
12.29 (-3.76%) |
12.77 |
11.63 - 13.03 |
0.6177 times |
Thu 31 July 2025 |
12.77 (-17.72%) |
15.82 |
12.51 - 16.92 |
3.6433 times |
Mon 30 June 2025 |
15.52 (36.62%) |
11.48 |
11.00 - 16.13 |
3.6113 times |
Fri 30 May 2025 |
11.36 (14.06%) |
9.95 |
9.50 - 11.72 |
0.3925 times |
Wed 30 April 2025 |
9.96 (1.74%) |
9.87 |
8.51 - 12.06 |
0.2915 times |
Fri 28 March 2025 |
9.79 (9.88%) |
9.08 |
8.44 - 10.74 |
0.3471 times |
Fri 28 February 2025 |
8.91 (-19.87%) |
11.10 |
8.85 - 11.40 |
0.2525 times |
DMA SMA EMA moving averages of Rattanindia Power RTNPOWER
DMA (daily moving average) of Rattanindia Power RTNPOWER
| DMA period | DMA value | | 5 day DMA | 9.83 | | 12 day DMA | 9.96 | | 20 day DMA | 10.08 | | 35 day DMA | 10.48 | | 50 day DMA | 10.76 | | 100 day DMA | 11.8 | | 150 day DMA | 12.08 | | 200 day DMA | 11.53 | EMA (exponential moving average) of Rattanindia Power RTNPOWER
| EMA period | EMA current | EMA prev | EMA prev2 | | 5 day EMA | 9.81 | 9.87 | 9.91 | | 12 day EMA | 9.96 | 10.01 | 10.05 | | 20 day EMA | 10.12 | 10.16 | 10.2 | | 35 day EMA | 10.44 | 10.48 | 10.52 | | 50 day EMA | 10.79 | 10.83 | 10.87 |
SMA (simple moving average) of Rattanindia Power RTNPOWER
| SMA period | SMA current | SMA prev | SMA prev2 | | 5 day SMA | 9.83 | 9.89 | 9.95 | | 12 day SMA | 9.96 | 10 | 10.02 | | 20 day SMA | 10.08 | 10.11 | 10.15 | | 35 day SMA | 10.48 | 10.52 | 10.56 | | 50 day SMA | 10.76 | 10.81 | 10.85 | | 100 day SMA | 11.8 | 11.87 | 11.93 | | 150 day SMA | 12.08 | 12.08 | 12.08 | | 200 day SMA | 11.53 | 11.53 | 11.54 |
|
|
