RattanindiaEnt RTNINDIA full analysis,charts,indicators,moving averages,SMA,DMA,EMA,ADX,MACD,RSIRattanindia Ent RTNINDIA WideScreen charts, DMA,SMA,EMA technical analysis, forecast prediction, by indicators ADX,MACD,RSI,CCI NSE stock exchange
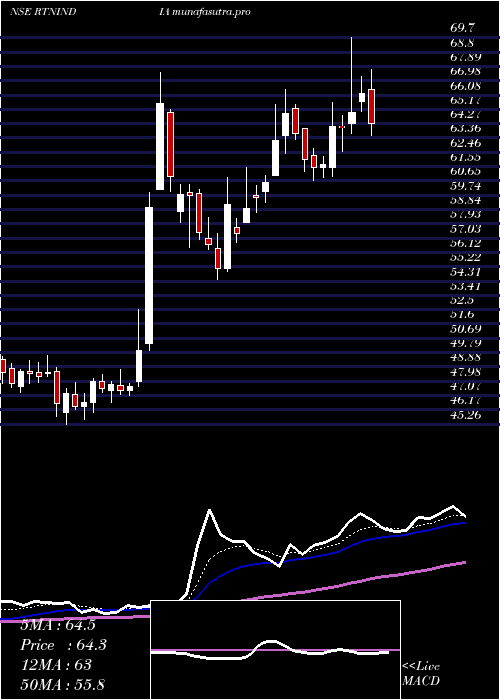
Daily price and charts and targets RattanindiaEnt Strong Daily Stock price targets for RattanindiaEnt RTNINDIA are 52.3 and 52.98 | Daily Target 1 | 52.14 | | Daily Target 2 | 52.45 | | Daily Target 3 | 52.82 | | Daily Target 4 | 53.13 | | Daily Target 5 | 53.5 |
Daily price and volume Rattanindia Ent
| Date |
Closing |
Open |
Range |
Volume |
Thu 30 October 2025 |
52.76 (-0.6%) |
52.92 |
52.51 - 53.19 |
0.5334 times |
Wed 29 October 2025 |
53.08 (-0.02%) |
53.19 |
52.45 - 53.45 |
1.0146 times |
Tue 28 October 2025 |
53.09 (0.68%) |
52.50 |
52.35 - 53.50 |
1.0701 times |
Mon 27 October 2025 |
52.73 (3.84%) |
51.04 |
50.70 - 54.39 |
3.6042 times |
Fri 24 October 2025 |
50.78 (-1.23%) |
51.39 |
50.54 - 51.49 |
0.6875 times |
Thu 23 October 2025 |
51.41 (0.86%) |
50.97 |
50.97 - 51.84 |
0.6666 times |
Tue 21 October 2025 |
50.97 (-0.18%) |
50.61 |
50.61 - 51.15 |
0.1895 times |
Mon 20 October 2025 |
51.06 (-0.82%) |
51.69 |
50.55 - 51.69 |
0.634 times |
Fri 17 October 2025 |
51.48 (0.84%) |
51.15 |
50.55 - 51.80 |
0.8771 times |
Thu 16 October 2025 |
51.05 (0.61%) |
51.00 |
50.80 - 51.45 |
0.7231 times |
Wed 15 October 2025 |
50.74 (0.65%) |
50.41 |
50.01 - 51.00 |
0.8934 times |
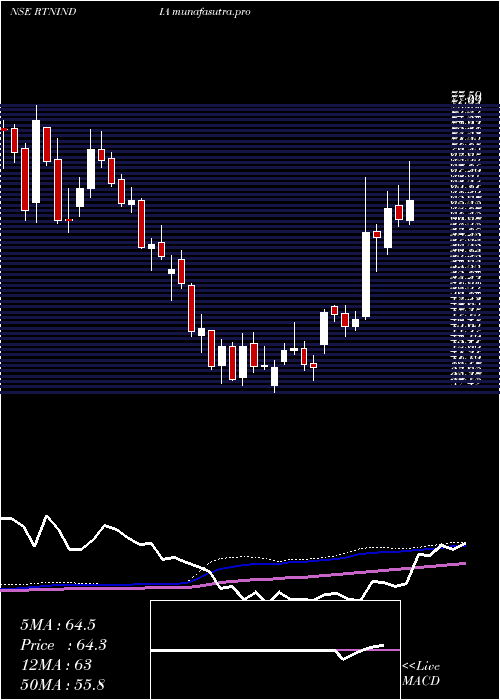
Weekly price and charts RattanindiaEnt Strong weekly Stock price targets for RattanindiaEnt RTNINDIA are 51.73 and 55.42 | Weekly Target 1 | 48.93 | | Weekly Target 2 | 50.84 | | Weekly Target 3 | 52.616666666667 | | Weekly Target 4 | 54.53 | | Weekly Target 5 | 56.31 |
Weekly price and volumes for Rattanindia Ent
| Date |
Closing |
Open |
Range |
Volume |
Thu 30 October 2025 |
52.76 (3.9%) |
51.04 |
50.70 - 54.39 |
0.2714 times |
Fri 24 October 2025 |
50.78 (-1.36%) |
51.69 |
50.54 - 51.84 |
0.095 times |
Fri 17 October 2025 |
51.48 (-1.08%) |
51.50 |
50.01 - 51.80 |
0.1888 times |
Fri 10 October 2025 |
52.04 (-1.29%) |
52.51 |
50.78 - 54.50 |
0.2791 times |
Fri 03 October 2025 |
52.72 (1.03%) |
52.96 |
50.68 - 53.77 |
0.3968 times |
Fri 26 September 2025 |
52.18 (-8.13%) |
56.80 |
51.80 - 57.25 |
0.2736 times |
Fri 19 September 2025 |
56.80 (0.58%) |
56.84 |
56.36 - 57.69 |
0.3145 times |
Fri 12 September 2025 |
56.47 (-8.88%) |
61.95 |
55.11 - 62.67 |
0.5541 times |
Fri 05 September 2025 |
61.97 (0.99%) |
61.06 |
58.50 - 64.00 |
1.6893 times |
Fri 29 August 2025 |
61.36 (16.52%) |
52.99 |
52.35 - 63.04 |
5.9373 times |
Fri 22 August 2025 |
52.66 (3.36%) |
51.95 |
51.48 - 55.37 |
0.3768 times |
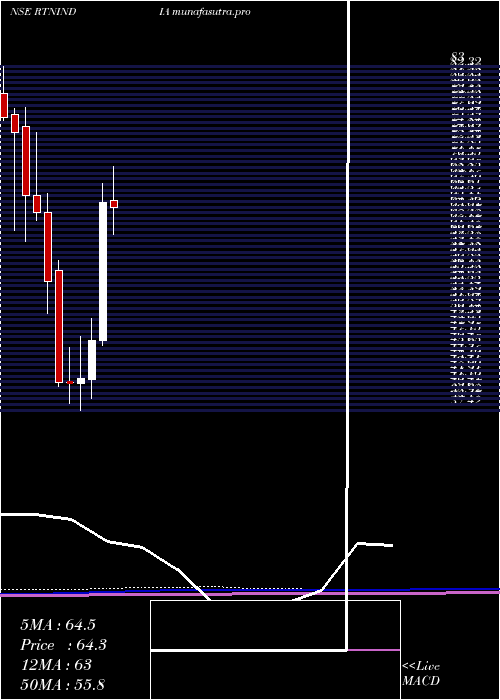
Monthly price and charts RattanindiaEnt Strong monthly Stock price targets for RattanindiaEnt RTNINDIA are 51.39 and 55.88 | Monthly Target 1 | 47.93 | | Monthly Target 2 | 50.35 | | Monthly Target 3 | 52.423333333333 | | Monthly Target 4 | 54.84 | | Monthly Target 5 | 56.91 |
Monthly price and volumes Rattanindia Ent
| Date |
Closing |
Open |
Range |
Volume |
Thu 30 October 2025 |
52.76 (3.23%) |
51.40 |
50.01 - 54.50 |
0.2657 times |
Tue 30 September 2025 |
51.11 (-16.7%) |
61.06 |
50.68 - 64.00 |
0.8552 times |
Fri 29 August 2025 |
61.36 (13.02%) |
54.50 |
49.53 - 63.04 |
1.9812 times |
Thu 31 July 2025 |
54.29 (-16.39%) |
65.21 |
53.57 - 69.70 |
1.3522 times |
Mon 30 June 2025 |
64.93 (39.19%) |
46.65 |
46.02 - 67.50 |
3.7673 times |
Fri 30 May 2025 |
46.65 (11.98%) |
41.45 |
38.99 - 49.58 |
0.3645 times |
Wed 30 April 2025 |
41.66 (1.49%) |
40.94 |
37.42 - 47.20 |
0.3156 times |
Fri 28 March 2025 |
41.05 (0.05%) |
41.11 |
38.30 - 45.79 |
0.5016 times |
Fri 28 February 2025 |
41.03 (-24.77%) |
56.00 |
40.59 - 57.24 |
0.2909 times |
Fri 31 January 2025 |
54.54 (-14.27%) |
63.62 |
50.20 - 66.17 |
0.3059 times |
Tue 31 December 2024 |
63.62 (-3.47%) |
65.91 |
62.57 - 74.30 |
0.5028 times |
DMA SMA EMA moving averages of Rattanindia Ent RTNINDIA
DMA (daily moving average) of Rattanindia Ent RTNINDIA
| DMA period | DMA value | | 5 day DMA | 52.49 | | 12 day DMA | 51.63 | | 20 day DMA | 51.81 | | 35 day DMA | 53.38 | | 50 day DMA | 54.82 | | 100 day DMA | 56.63 | | 150 day DMA | 52.56 | | 200 day DMA | 51.69 | EMA (exponential moving average) of Rattanindia Ent RTNINDIA
| EMA period | EMA current | EMA prev | EMA prev2 | | 5 day EMA | 52.54 | 52.43 | 52.11 | | 12 day EMA | 52.15 | 52.04 | 51.85 | | 20 day EMA | 52.33 | 52.28 | 52.2 | | 35 day EMA | 53.18 | 53.2 | 53.21 | | 50 day EMA | 54.33 | 54.39 | 54.44 |
SMA (simple moving average) of Rattanindia Ent RTNINDIA
| SMA period | SMA current | SMA prev | SMA prev2 | | 5 day SMA | 52.49 | 52.22 | 51.8 | | 12 day SMA | 51.63 | 51.5 | 51.41 | | 20 day SMA | 51.81 | 51.72 | 51.67 | | 35 day SMA | 53.38 | 53.59 | 53.82 | | 50 day SMA | 54.82 | 54.8 | 54.76 | | 100 day SMA | 56.63 | 56.58 | 56.52 | | 150 day SMA | 52.56 | 52.5 | 52.43 | | 200 day SMA | 51.69 | 51.73 | 51.78 |
|
|
