RSystems RSYSTEMS full analysis,charts,indicators,moving averages,SMA,DMA,EMA,ADX,MACD,RSIR Systems RSYSTEMS WideScreen charts, DMA,SMA,EMA technical analysis, forecast prediction, by indicators ADX,MACD,RSI,CCI NSE stock exchange
operates under IT Consulting & Software sector
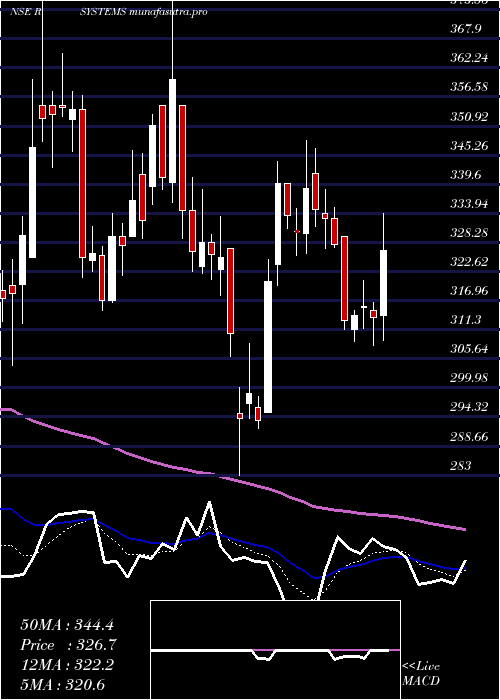
Daily price and charts and targets RSystems Strong Daily Stock price targets for RSystems RSYSTEMS are 409.83 and 414.78 | Daily Target 1 | 408.3 | | Daily Target 2 | 411.35 | | Daily Target 3 | 413.25 | | Daily Target 4 | 416.3 | | Daily Target 5 | 418.2 |
Daily price and volume R Systems
| Date |
Closing |
Open |
Range |
Volume |
Wed 29 October 2025 |
414.40 (0.36%) |
414.95 |
410.20 - 415.15 |
0.539 times |
Tue 28 October 2025 |
412.90 (-0.52%) |
416.70 |
406.60 - 416.70 |
0.874 times |
Mon 27 October 2025 |
415.05 (1.28%) |
411.90 |
409.30 - 420.00 |
0.9475 times |
Fri 24 October 2025 |
409.80 (-1.25%) |
416.80 |
407.00 - 416.80 |
2.2898 times |
Thu 23 October 2025 |
415.00 (-1%) |
422.00 |
413.30 - 427.40 |
0.7526 times |
Tue 21 October 2025 |
419.20 (-0.19%) |
411.75 |
411.75 - 422.80 |
0.3349 times |
Mon 20 October 2025 |
420.00 (0.66%) |
415.10 |
415.10 - 429.00 |
1.7368 times |
Fri 17 October 2025 |
417.25 (-0.1%) |
413.90 |
411.30 - 420.10 |
0.8761 times |
Thu 16 October 2025 |
417.65 (0.97%) |
413.65 |
407.85 - 419.90 |
0.4614 times |
Wed 15 October 2025 |
413.65 (1.08%) |
411.30 |
403.40 - 418.00 |
1.1878 times |
Tue 14 October 2025 |
409.25 (-1%) |
412.00 |
405.65 - 419.00 |
0.6611 times |
Weekly price and charts RSystems Strong weekly Stock price targets for RSystems RSYSTEMS are 410.5 and 423.9 | Weekly Target 1 | 400.27 | | Weekly Target 2 | 407.33 | | Weekly Target 3 | 413.66666666667 | | Weekly Target 4 | 420.73 | | Weekly Target 5 | 427.07 |
Weekly price and volumes for R Systems
| Date |
Closing |
Open |
Range |
Volume |
Wed 29 October 2025 |
414.40 (1.12%) |
411.90 |
406.60 - 420.00 |
0.1441 times |
Fri 24 October 2025 |
409.80 (-1.79%) |
415.10 |
407.00 - 429.00 |
0.3121 times |
Fri 17 October 2025 |
417.25 (-0.97%) |
423.00 |
403.40 - 423.00 |
0.2517 times |
Fri 10 October 2025 |
421.35 (1.81%) |
408.10 |
408.10 - 425.45 |
0.2234 times |
Fri 03 October 2025 |
413.85 (-0.56%) |
413.05 |
398.15 - 419.15 |
0.2805 times |
Fri 26 September 2025 |
416.20 (-6.16%) |
443.00 |
414.35 - 443.00 |
0.4912 times |
Fri 19 September 2025 |
443.50 (-1.33%) |
447.40 |
437.10 - 451.75 |
0.5598 times |
Fri 12 September 2025 |
449.50 (-0.63%) |
452.35 |
441.90 - 472.90 |
0.7646 times |
Fri 05 September 2025 |
452.35 (-2%) |
460.00 |
450.15 - 485.00 |
0.8419 times |
Fri 29 August 2025 |
461.60 (3.45%) |
455.15 |
445.50 - 492.00 |
6.1307 times |
Fri 22 August 2025 |
446.20 (2.94%) |
438.00 |
415.20 - 496.90 |
12.758 times |
Monthly price and charts RSystems Strong monthly Stock price targets for RSystems RSYSTEMS are 408.2 and 435.2 | Monthly Target 1 | 388.13 | | Monthly Target 2 | 401.27 | | Monthly Target 3 | 415.13333333333 | | Monthly Target 4 | 428.27 | | Monthly Target 5 | 442.13 |
Monthly price and volumes R Systems
| Date |
Closing |
Open |
Range |
Volume |
Wed 29 October 2025 |
414.40 (3.39%) |
402.90 |
402.00 - 429.00 |
0.2482 times |
Tue 30 September 2025 |
400.80 (-13.17%) |
460.00 |
398.15 - 485.00 |
0.6887 times |
Fri 29 August 2025 |
461.60 (10.4%) |
419.90 |
413.95 - 496.90 |
4.7823 times |
Thu 31 July 2025 |
418.10 (-9.06%) |
455.10 |
408.35 - 477.50 |
0.4812 times |
Mon 30 June 2025 |
459.75 (25.46%) |
369.60 |
363.95 - 479.00 |
1.335 times |
Fri 30 May 2025 |
366.45 (16.83%) |
314.00 |
306.55 - 389.00 |
0.4129 times |
Wed 30 April 2025 |
313.65 (-3.92%) |
323.50 |
283.00 - 348.10 |
0.4202 times |
Fri 28 March 2025 |
326.45 (2.87%) |
319.85 |
304.25 - 385.00 |
0.7897 times |
Fri 28 February 2025 |
317.35 (-25.25%) |
420.30 |
312.80 - 427.00 |
0.4232 times |
Fri 31 January 2025 |
424.55 (-8.85%) |
467.60 |
397.20 - 484.85 |
0.4186 times |
Tue 31 December 2024 |
465.75 (-5.37%) |
495.55 |
461.00 - 522.90 |
0.6298 times |
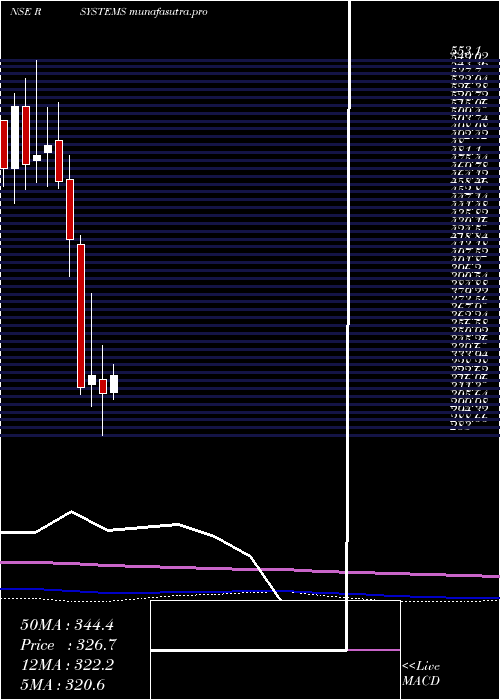
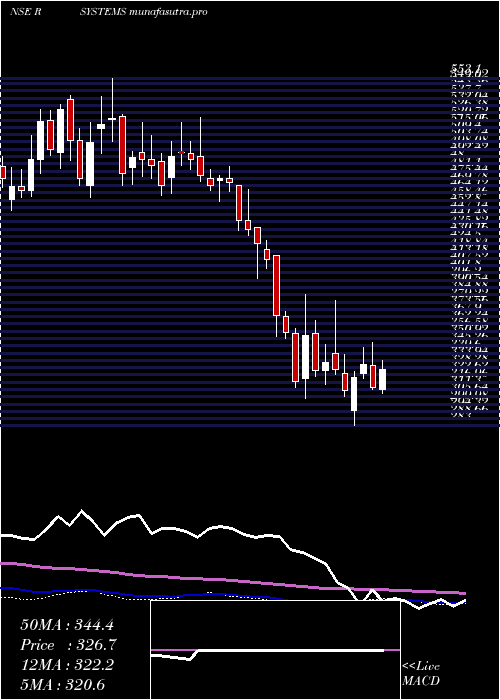
DMA SMA EMA moving averages of R Systems RSYSTEMS
DMA (daily moving average) of R Systems RSYSTEMS
| DMA period | DMA value | | 5 day DMA | 413.43 | | 12 day DMA | 414.8 | | 20 day DMA | 415.23 | | 35 day DMA | 424.73 | | 50 day DMA | 432.13 | | 100 day DMA | 434.88 | | 150 day DMA | 403.77 | | 200 day DMA | 400.22 | EMA (exponential moving average) of R Systems RSYSTEMS
| EMA period | EMA current | EMA prev | EMA prev2 | | 5 day EMA | 414.22 | 414.13 | 414.74 | | 12 day EMA | 415.49 | 415.69 | 416.2 | | 20 day EMA | 417.84 | 418.2 | 418.76 | | 35 day EMA | 423.67 | 424.22 | 424.89 | | 50 day EMA | 430.21 | 430.85 | 431.58 |
SMA (simple moving average) of R Systems RSYSTEMS
| SMA period | SMA current | SMA prev | SMA prev2 | | 5 day SMA | 413.43 | 414.39 | 415.81 | | 12 day SMA | 414.8 | 415.38 | 415.93 | | 20 day SMA | 415.23 | 414.86 | 415.02 | | 35 day SMA | 424.73 | 425.78 | 426.91 | | 50 day SMA | 432.13 | 432.52 | 433.23 | | 100 day SMA | 434.88 | 434.43 | 434.04 | | 150 day SMA | 403.77 | 403.25 | 402.68 | | 200 day SMA | 400.22 | 400.52 | 400.81 |
|
|
