RS RSSOFTWARE full analysis,charts,indicators,moving averages,SMA,DMA,EMA,ADX,MACD,RSIR S RSSOFTWARE WideScreen charts, DMA,SMA,EMA technical analysis, forecast prediction, by indicators ADX,MACD,RSI,CCI NSE stock exchange
operates under IT Software Products sector
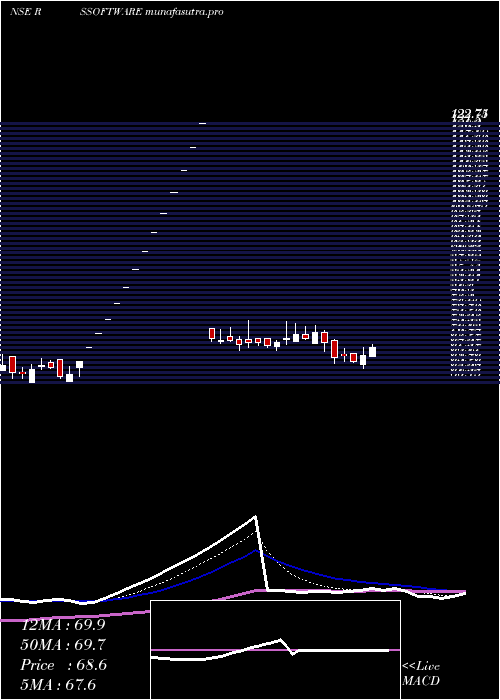
Daily price and charts and targets RS Strong Daily Stock price targets for RS RSSOFTWARE are 65.19 and 70.19 | Daily Target 1 | 61.35 | | Daily Target 2 | 64.03 | | Daily Target 3 | 66.353333333333 | | Daily Target 4 | 69.03 | | Daily Target 5 | 71.35 |
Daily price and volume R S
| Date |
Closing |
Open |
Range |
Volume |
Wed 29 October 2025 |
66.70 (2.38%) |
64.65 |
63.68 - 68.68 |
1.4874 times |
Tue 28 October 2025 |
65.15 (-2.27%) |
67.28 |
65.00 - 67.28 |
0.3914 times |
Mon 27 October 2025 |
66.66 (0.69%) |
66.89 |
65.22 - 68.29 |
0.7644 times |
Fri 24 October 2025 |
66.20 (-5.35%) |
70.40 |
64.76 - 70.47 |
1.4879 times |
Thu 23 October 2025 |
69.94 (-3.05%) |
72.14 |
67.70 - 72.69 |
1.1557 times |
Tue 21 October 2025 |
72.14 (1.81%) |
69.50 |
69.50 - 73.99 |
0.1499 times |
Mon 20 October 2025 |
70.86 (-1.32%) |
71.80 |
70.50 - 73.73 |
1.7531 times |
Fri 17 October 2025 |
71.81 (1.46%) |
70.10 |
70.10 - 74.46 |
1.1037 times |
Thu 16 October 2025 |
70.78 (1.27%) |
70.47 |
69.27 - 75.00 |
1.4955 times |
Wed 15 October 2025 |
69.89 (1.19%) |
69.00 |
67.95 - 70.40 |
0.2111 times |
Tue 14 October 2025 |
69.07 (-0.96%) |
70.73 |
68.53 - 70.80 |
0.4958 times |
Weekly price and charts RS Strong weekly Stock price targets for RS RSSOFTWARE are 62.69 and 67.69 | Weekly Target 1 | 61.35 | | Weekly Target 2 | 64.03 | | Weekly Target 3 | 66.353333333333 | | Weekly Target 4 | 69.03 | | Weekly Target 5 | 71.35 |
Weekly price and volumes for R S
| Date |
Closing |
Open |
Range |
Volume |
Wed 29 October 2025 |
66.70 (0.76%) |
66.89 |
63.68 - 68.68 |
0.5022 times |
Fri 24 October 2025 |
66.20 (-7.81%) |
71.80 |
64.76 - 73.99 |
0.8639 times |
Fri 17 October 2025 |
71.81 (2.91%) |
70.80 |
67.95 - 75.00 |
0.6898 times |
Fri 10 October 2025 |
69.78 (-43.15%) |
73.27 |
67.82 - 75.25 |
0.4608 times |
Wed 14 February 2024 |
122.75 (15.69%) |
111.40 |
111.40 - 122.75 |
0.289 times |
Fri 09 February 2024 |
106.10 (27.52%) |
87.35 |
87.35 - 106.10 |
2.7539 times |
Fri 02 February 2024 |
83.20 (27.41%) |
68.55 |
68.55 - 83.20 |
0.4256 times |
Thu 25 January 2024 |
65.30 (1.48%) |
65.00 |
60.55 - 65.85 |
0.7912 times |
Fri 19 January 2024 |
64.35 (0.55%) |
63.20 |
60.15 - 66.85 |
0.9889 times |
Fri 12 January 2024 |
64.00 (-3.69%) |
69.75 |
60.85 - 69.75 |
2.2348 times |
Fri 05 January 2024 |
66.45 (13.49%) |
59.00 |
57.95 - 66.45 |
0.8555 times |

Monthly price and charts RS Strong monthly Stock price targets for RS RSSOFTWARE are 59.41 and 70.98 | Monthly Target 1 | 56.97 | | Monthly Target 2 | 61.84 | | Monthly Target 3 | 68.543333333333 | | Monthly Target 4 | 73.41 | | Monthly Target 5 | 80.11 |
Monthly price and volumes R S
| Date |
Closing |
Open |
Range |
Volume |
Wed 29 October 2025 |
66.70 (-45.66%) |
73.27 |
63.68 - 75.25 |
0.46 times |
Wed 14 February 2024 |
122.75 (62.58%) |
79.25 |
79.25 - 122.75 |
0.5874 times |
Wed 31 January 2024 |
75.50 (28.95%) |
59.00 |
57.95 - 75.50 |
0.9367 times |
Fri 29 December 2023 |
58.55 (52.47%) |
63.70 |
57.30 - 65.90 |
0.5044 times |
Thu 04 May 2023 |
38.40 (16.72%) |
33.20 |
31.00 - 38.40 |
0.6104 times |
Fri 28 April 2023 |
32.90 (48.2%) |
22.55 |
22.50 - 37.20 |
4.4434 times |
Fri 31 March 2023 |
22.20 (-17.01%) |
27.15 |
21.10 - 27.15 |
0.3665 times |
Tue 28 February 2023 |
26.75 (3.68%) |
26.80 |
23.40 - 27.75 |
0.773 times |
Tue 31 January 2023 |
25.80 (3.82%) |
24.90 |
23.05 - 27.25 |
0.6358 times |
Fri 30 December 2022 |
24.85 (-4.42%) |
26.45 |
23.00 - 27.80 |
0.6824 times |
Wed 30 November 2022 |
26.00 (-6.31%) |
27.95 |
25.40 - 29.35 |
0.5623 times |

DMA SMA EMA moving averages of R S RSSOFTWARE
DMA (daily moving average) of R S RSSOFTWARE
| DMA period | DMA value | | 5 day DMA | 66.93 | | 12 day DMA | 69.08 | | 20 day DMA | 76.53 | | 35 day DMA | 77.4 | | 50 day DMA | 73.04 | | 100 day DMA | 54.15 | | 150 day DMA | 44.42 | | 200 day DMA | 40.02 | EMA (exponential moving average) of R S RSSOFTWARE
| EMA period | EMA current | EMA prev | EMA prev2 | | 5 day EMA | 67.15 | 67.37 | 68.48 | | 12 day EMA | 70.08 | 70.69 | 71.7 | | 20 day EMA | 72.55 | 73.16 | 74 | | 35 day EMA | 72.03 | 72.34 | 72.76 | | 50 day EMA | 71.46 | 71.65 | 71.92 |
SMA (simple moving average) of R S RSSOFTWARE
| SMA period | SMA current | SMA prev | SMA prev2 | | 5 day SMA | 66.93 | 68.02 | 69.16 | | 12 day SMA | 69.08 | 69.34 | 69.69 | | 20 day SMA | 76.53 | 78.5 | 80.3 | | 35 day SMA | 77.4 | 77.3 | 77.22 | | 50 day SMA | 73.04 | 72.9 | 72.85 | | 100 day SMA | 54.15 | 53.74 | 53.34 | | 150 day SMA | 44.42 | 44.14 | 43.87 | | 200 day SMA | 40.02 | 39.82 | 39.64 |
|
|
