RashiPeripherals RPTECH full analysis,charts,indicators,moving averages,SMA,DMA,EMA,ADX,MACD,RSIRashi Peripherals RPTECH WideScreen charts, DMA,SMA,EMA technical analysis, forecast prediction, by indicators ADX,MACD,RSI,CCI NSE stock exchange
Daily price and charts and targets RashiPeripherals Strong Daily Stock price targets for RashiPeripherals RPTECH are 333.15 and 339.4 | Daily Target 1 | 331.77 | | Daily Target 2 | 334.53 | | Daily Target 3 | 338.01666666667 | | Daily Target 4 | 340.78 | | Daily Target 5 | 344.27 |
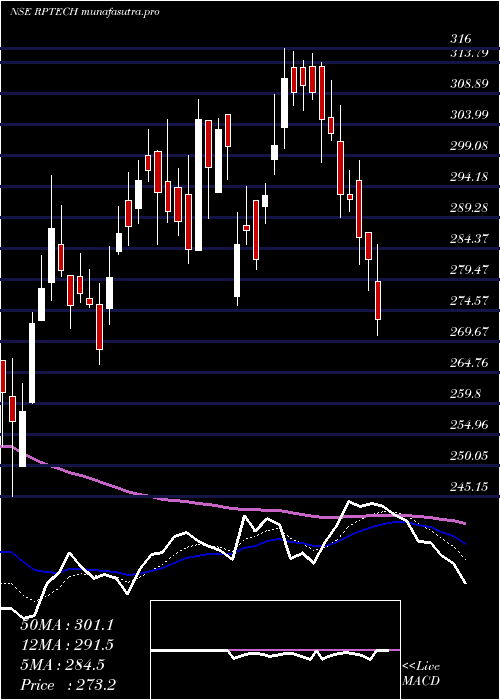
Daily price and volume Rashi Peripherals
| Date |
Closing |
Open |
Range |
Volume |
Wed 29 October 2025 |
337.30 (-0.52%) |
339.05 |
335.25 - 341.50 |
0.9978 times |
Tue 28 October 2025 |
339.05 (2.03%) |
333.00 |
332.30 - 345.95 |
1.5959 times |
Mon 27 October 2025 |
332.30 (0.26%) |
331.45 |
329.00 - 334.00 |
0.6154 times |
Fri 24 October 2025 |
331.45 (0.52%) |
329.75 |
326.35 - 337.70 |
0.8643 times |
Thu 23 October 2025 |
329.75 (-2.08%) |
336.95 |
326.55 - 342.00 |
1.795 times |
Tue 21 October 2025 |
336.75 (0.19%) |
338.80 |
335.00 - 341.70 |
0.294 times |
Mon 20 October 2025 |
336.10 (2.55%) |
332.20 |
325.00 - 339.40 |
0.6105 times |
Fri 17 October 2025 |
327.75 (-0.52%) |
330.00 |
322.80 - 330.90 |
1.0696 times |
Thu 16 October 2025 |
329.45 (-1.32%) |
336.40 |
325.35 - 336.40 |
1.1236 times |
Wed 15 October 2025 |
333.85 (2.35%) |
327.80 |
322.70 - 336.00 |
1.0339 times |
Tue 14 October 2025 |
326.20 (-2.2%) |
336.00 |
322.55 - 336.00 |
1.0781 times |
Weekly price and charts RashiPeripherals Strong weekly Stock price targets for RashiPeripherals RPTECH are 333.15 and 350.1 | Weekly Target 1 | 320.47 | | Weekly Target 2 | 328.88 | | Weekly Target 3 | 337.41666666667 | | Weekly Target 4 | 345.83 | | Weekly Target 5 | 354.37 |
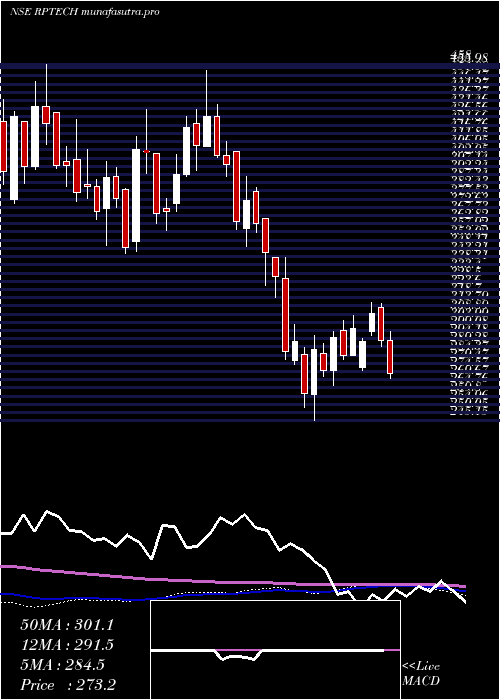
Weekly price and volumes for Rashi Peripherals
| Date |
Closing |
Open |
Range |
Volume |
Wed 29 October 2025 |
337.30 (1.76%) |
331.45 |
329.00 - 345.95 |
0.3727 times |
Fri 24 October 2025 |
331.45 (1.13%) |
332.20 |
325.00 - 342.00 |
0.4139 times |
Fri 17 October 2025 |
327.75 (-6.1%) |
349.85 |
322.55 - 351.05 |
0.7351 times |
Fri 10 October 2025 |
349.05 (10.49%) |
318.00 |
313.05 - 352.00 |
1.0642 times |
Fri 03 October 2025 |
315.90 (0.14%) |
316.05 |
315.05 - 331.45 |
0.4759 times |
Fri 26 September 2025 |
315.45 (-0.83%) |
322.00 |
310.80 - 340.60 |
1.4121 times |
Fri 19 September 2025 |
318.10 (5.72%) |
300.00 |
298.40 - 324.80 |
0.8934 times |
Fri 12 September 2025 |
300.90 (1.66%) |
299.65 |
292.25 - 314.25 |
1.3701 times |
Fri 05 September 2025 |
296.00 (4.69%) |
281.50 |
276.55 - 313.65 |
2.2563 times |
Fri 29 August 2025 |
282.75 (-0.07%) |
283.50 |
278.05 - 287.90 |
1.0063 times |
Fri 22 August 2025 |
282.95 (-0.14%) |
283.40 |
276.00 - 288.00 |
1.4845 times |
Monthly price and charts RashiPeripherals Strong monthly Stock price targets for RashiPeripherals RPTECH are 325.18 and 364.13 | Monthly Target 1 | 295.17 | | Monthly Target 2 | 316.23 | | Monthly Target 3 | 334.11666666667 | | Monthly Target 4 | 355.18 | | Monthly Target 5 | 373.07 |
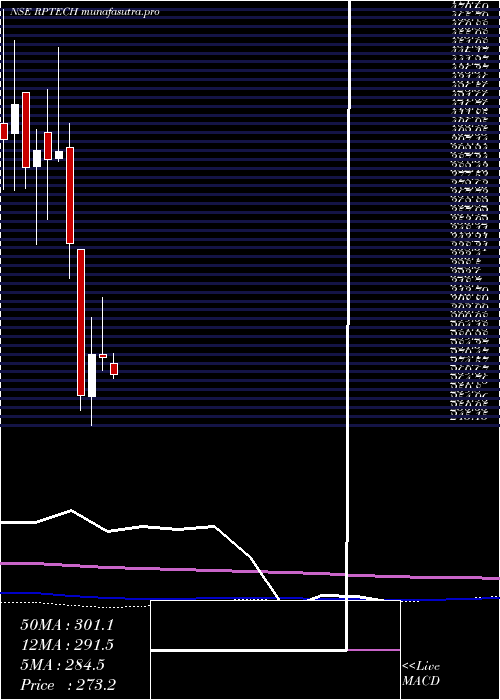
Monthly price and volumes Rashi Peripherals
| Date |
Closing |
Open |
Range |
Volume |
Wed 29 October 2025 |
337.30 (4.1%) |
326.60 |
313.05 - 352.00 |
0.9528 times |
Tue 30 September 2025 |
324.00 (14.59%) |
281.50 |
276.55 - 340.60 |
2.0898 times |
Fri 29 August 2025 |
282.75 (-1.39%) |
289.60 |
275.60 - 310.35 |
1.4094 times |
Thu 31 July 2025 |
286.75 (-6.05%) |
305.20 |
280.80 - 321.00 |
0.622 times |
Mon 30 June 2025 |
305.20 (-0.94%) |
311.00 |
290.40 - 325.00 |
0.489 times |
Fri 30 May 2025 |
308.10 (9%) |
279.20 |
260.80 - 329.70 |
0.7551 times |
Wed 30 April 2025 |
282.65 (-0.58%) |
284.00 |
275.40 - 316.00 |
0.5588 times |
Fri 28 March 2025 |
284.30 (8.66%) |
261.00 |
245.15 - 304.75 |
1.0612 times |
Fri 28 February 2025 |
261.65 (-24.29%) |
342.50 |
253.05 - 342.50 |
0.9606 times |
Fri 31 January 2025 |
345.60 (-12.84%) |
399.00 |
326.20 - 412.00 |
1.1011 times |
Tue 31 December 2024 |
396.50 (1.11%) |
392.50 |
391.00 - 454.25 |
2.2027 times |
DMA SMA EMA moving averages of Rashi Peripherals RPTECH
DMA (daily moving average) of Rashi Peripherals RPTECH
| DMA period | DMA value | | 5 day DMA | 333.97 | | 12 day DMA | 332.79 | | 20 day DMA | 329.94 | | 35 day DMA | 322.82 | | 50 day DMA | 311.78 | | 100 day DMA | 305.27 | | 150 day DMA | 302.65 | | 200 day DMA | 306.42 | EMA (exponential moving average) of Rashi Peripherals RPTECH
| EMA period | EMA current | EMA prev | EMA prev2 | | 5 day EMA | 335.39 | 334.44 | 332.13 | | 12 day EMA | 332.85 | 332.04 | 330.77 | | 20 day EMA | 329.29 | 328.45 | 327.33 | | 35 day EMA | 320.45 | 319.46 | 318.31 | | 50 day EMA | 311.48 | 310.43 | 309.26 |
SMA (simple moving average) of Rashi Peripherals RPTECH
| SMA period | SMA current | SMA prev | SMA prev2 | | 5 day SMA | 333.97 | 333.86 | 333.27 | | 12 day SMA | 332.79 | 333.77 | 333.43 | | 20 day SMA | 329.94 | 329.19 | 328.01 | | 35 day SMA | 322.82 | 321.79 | 320.56 | | 50 day SMA | 311.78 | 310.7 | 309.52 | | 100 day SMA | 305.27 | 305.03 | 304.74 | | 150 day SMA | 302.65 | 302.32 | 301.97 | | 200 day SMA | 306.42 | 306.68 | 306.88 |
|
|
